


iVSA Trading Tips and Plans
iVSA Article 16 - Importance of Market Structure & How to Identify Them

Introduction
As discussed in previous “iVSA Article 6 - How to Detect Smart Money Movement” http://klse.i3investor.com/blogs/ivsatradingtipsandplans/96519.jsp, understanding the market structures is the key to uncover the footprints of smart money. When smart money movements are unveiled through chart reading, the chances of taking position at the right timing and having a successful trade is highly increased, as we are able to follow the smart money movements, namely, when they buy we buy and when they sell we sell.
Market structure consists of four stages, namely “Accumulation”, “Mark Up”, “Distribution” and “Mark Down”. Details of what does the smart money do in each stages were discussed in previous “iVSA Article 6 - How to Detect Smart Money Movement” http://klse.i3investor.com/blogs/ivsatradingtipsandplans/96519.jsp, but in a nut shell, smart money has net buys (namely having both buy & sell transactions but buy more) at Accumulation & Mark Up stages while having net sells (namely having both buy & sell transactions but sell more) at Distribution & Mark Down stages.
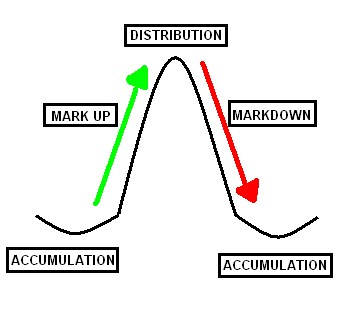
It is relatively straight forward to identify Mark Up and Mark Down stages, as prices move up and down with wide spread bars and accompanied by high volume, the real challenge is to differentiate between Accumulation and Distribution stages as the behaviour of both stages are similar whereby prices move sideways with narrow spread bars and accompanied by low volume. To be a winning trader or investor, it is important to master this skill of differentiation and always take position in Accumulation stage and let the profit run during Mark Up stage but not during Distribution stage and risking substantial losses during Mark Down stage (as the stock price has move up a lot after the Mark Up stage). Here are some guidelines to help traders or investors on how to differentiate between Accumulation and Distribution Stage.
Identify a Previous Mark Down
Chances of the share price having sideways movement being in an Accumulation stage is highly increased when there has been a previous Mark Down stage. This is because Mark Down indicates that smart money has already sold their stakes and ready to push down the prices to start another Accumulation stage. It is even more evident if the Mark Down stage was after a Distribution stage whereby price move sideways before the Mark Down stage.
Identify Support Levels
Accumulation usually happens at price level very close to old support levels whereby prices hardly drops below these support levels unless there is sizeable volume. These support levels can be identified by looking through historical price movements whereby prices tend to stay or rebound when hitting these price levels. On the contrary, distribution typically happens close to resistance area whereby higher price above this levels are rejected and requires substantial volume to break through these resistance levels.
Duration of Sideways Movement
Accumulation stages usually last longer than Distribution stage. This is due to the slow and subtle buying by the smart money operators which does not want the price to go up and also with the intention to stay unnoticed when they are accumulating the shares in bulk over a period of time. Therefore, they have to spread out their buying through many weeks or even months.
However, during Distribution stage, as the price has already been mark up substantially and couple with a well-planned campaign to promote the stock to intentionally catch public uninformed traders attention, the selling of smart money during Distribution stage is greatly absorbed by the buying from the public influenced by the information engineered through the well-planned campaign by smart money, with the hopes that the price will go even higher. Therefore, Distribution stage is usually with relatively shorter duration and with higher than usual volume as smart money could sell their stakes much faster than buying during Accumulation stage.
Example
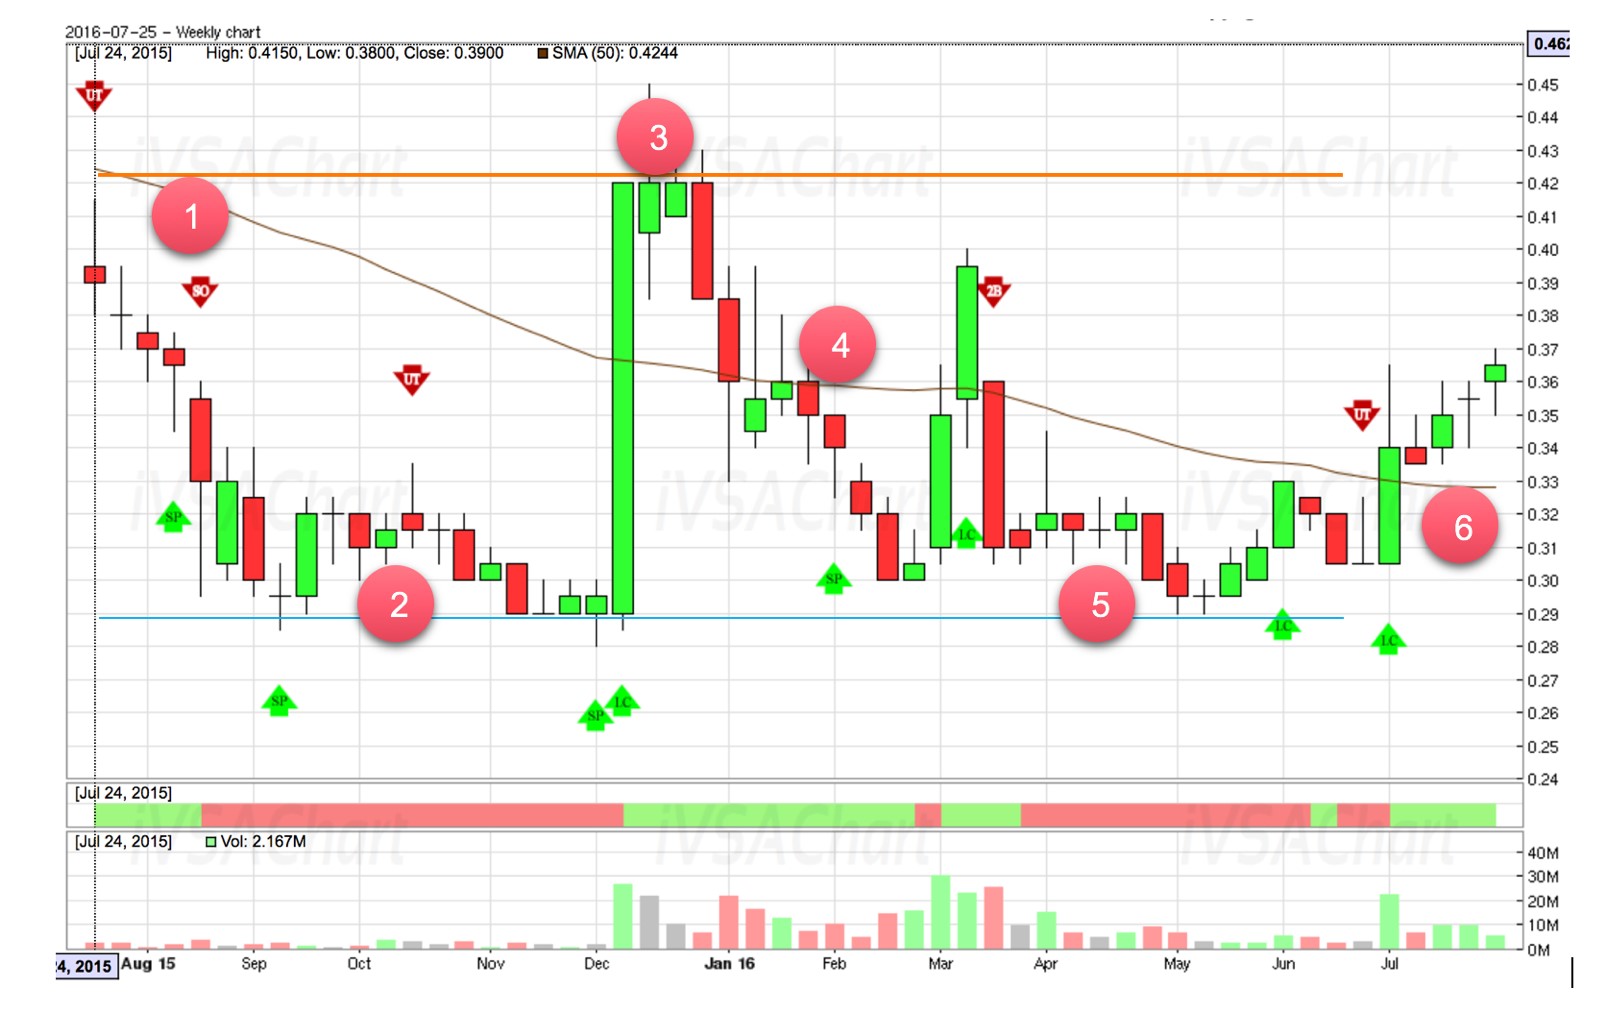
Example below is a 1-year weekly iVSAChart of SGX stock to illustrate the various market stages:
Point 1: Mark Down stage with wide spread down bars
Point 2: Accumulation stage with prices well supported around the blue line (support level) and sideways price movements with low volume that lasted through a long period of many weeks of accumulation and hidden buying by smart money
Point 3: Mark Up stage followed by a very short Distribution stage with relatively higher volume, and prices unable to break through the resistance levels (around orange line)
Point 4: Mark Down stage with hidden selling by smart money and the stock reverse its uptrend
Point 5: At this juncture, with the observations of Point 1 to 4 above and the stock price is close to its old support level (blue line), a trained iVSA trader or investor would be able to assess that this stock is likely in Accumulation stage again and begins to take position ahead of the public crowd as this trade presents a very good reward-to-risk ratio and is considered a trade with good setup and high odds of winning
Point 6: Mark up stage starts again and trained iVSA traders or investors should be running their profits now, while the uninformed traders may only start to take notice now after the price has run up >20% in this example.
Conclusion
Above are some selected basic guidelines to identify different stages of market structure. More in-depth analysis will require further detailed knowledge on Volume Spread Analysis (VSA) in order to identify more prominent characteristics of Accumulation and Distribution stages using daily or weekly price and volume charts. This will highly increase the success rates of uncovering the footprints of smart money operators.
Remember this, a winning iVSA and professional trader or investor always follow the smart money by buying at Accumulation and/or beginning of Mark Up stage and selling during Distribution and/or beginning of Mark Down stage, while the uninformed public traders or investors will likely do the opposite as they like to get free stock tips from newspaper, popular investment forum, bloggers, etc. and follow the crowd (namely when everyone is talking about the hottest stocks in town, then they think that they can profit from it by chasing these hottest stocks without knowing that smart money is selling to them).
Unfortunately, it has been proven that majority of uninformed mass market, retail traders/investors that love to follow free stock tips blindly (hoping for quick profits) but without having the proper knowledge to read and analyse charts, will end up losing lots more money from the supposing free stock tips!
Watch out for next article in this series of education articles brought to you by iVSAChart, “Article 17 – Ten Warning Signs of Declining Stock” under Series D: Daily Guide for Traders & Investors.
Interested to learn more?
- Join our Investment & Market Outlook Conference on 28th Aug 2016. Free door gift WORTH RM50. Find out more via: https://www.ivsachart.com/investconference2016.php
- Website: https://www.ivsachart.com/events.php
- Email: sales@ivsachart.com
- WhatsApp: +6011 2125 8389/ +6018 286 9809
- Follow & Like us on Facebook: https://www.facebook.com/priceandvolumeinklse/
This article only serves as reference information and does not constitute a buy or sell call. Conduct your own research and assessment before deciding to buy or sell any stock. If you decide to buy or sell any stock, you are responsible for your own decision and associated risks.
More articles on iVSA Trading Tips and Plans
iVSA Article 19 - Ten Challenges and Opportunities in Stock Market
Created by Joe Cool | Sep 29, 2016
Featured Posts


Latest Videos


Apps


Top Articles
1
南洋行家论股
2
BreakingOut
3
Koon Yew Yin's Blog
4
Bursa Stock Musings - Thoughts & Ideas
PGF Capital - insti shareholding up from 5% to 14%! (part 1)
5
The Alpha Trader
6
南洋行家论股
7
RHB Investment Research Reports
8
How to become a resilient trader
#
Stock
Score
Daily Stocks
Stock Name
Last
Change
Volume
Stock Name
Last
Change
Volume
Stock Name
Last
Change
Volume
MQ Trading Signals
Stock
Time
Signal
Duration
Stock
Time
Signal
Duration
Featured Advertisers / Partners


Ride The Bull Short The Bear
CS Tan
4.9 / 5.0
This book is the result of the author's many years of experience and observation throughout his 26 years in the stockbroking industry. It was written for general public to learn to invest based on facts and not on fantasies or hearsay....