


iVSA Trading Tips and Plans
iVSA Article 14 - Importance of Chart Reading

Introduction
To be a winning trader or investor, we can’t just place our money in shares that we like and hope for it to balloon. There is a very important instrument that we must learn to analyse in order to ensure that we have an edge in trading or investing, which are charts. Chart reading is considered as Technical Analysis approach and can be used in conjunction with Fundamental Analysis as discussed in previous “iVSA Article 3: What are the differences between Fundamental Analysis and Technical Analysis?” http://klse.i3investor.com/blogs/ivsatradingtipsandplans/95311.jsp
Charts are historical record of securities’ price movement and related volume over time. As these price movement figures and dates are being represented in a graphical manner, charts make it easier for traders or investors to identify a particular stock’s price performance over time and use the chart to further derive trends or patterns to anticipate its future trends movements.
Below are selected examples of information that traders or investors can analyse through chart reading to support decision making before placing a trade in shares.
Identify General Price Trends
General price trends of a stock in six-month to one-year timeframe is a high level indicator of the long term direction that the share price is heading to. If the six-month’s price trend is generally slopping up, most likely it will continue in this direction if the company’s financial performance continues to be growing consistently. On the flip side, if the price trend is a downward slop, most likely the company’s financial performance is not doing well or the industry is at its low growth periods.
Sideway movements generally indicate the company is at slow or no growth phase, or it has not gain sufficient attention from public or private investors to invest in its stock. Highly fluctuating price movements shows that the company’s financial performance is highly dependent on volatile external factors such as commodity prices, exchange rates, economy sediments etc.
With the above knowledge, an experienced trader or investor should use different approach when investing in these four different types of price trends. For example, for upward trending stocks, traders or investors can look for temporary price dip as opportunities to take position, in anticipation of long term price movement that will likely continue its uptrends.
Identify Unusual Price Spikes
A big price spike upwards or downwards usually means something significant has happened to the company and definitely worth noting as it represents a great opportunity for winning traders and investors. One of the most common cause of spikes are company’s quarterly result announcements.
For example, the chart below illustrates the after effect of quarterly results announcement. At point A, quarterly results were bad and the company made a lost, causing a price spike downwards. On the contrary, at point B, the company turned from losing to profitable position, causing a price spike upwards. Winning traders or investors who anticipate a good quarterly result announcement at point B will take position before hand and make a lucrative profit from the upwards price spike.
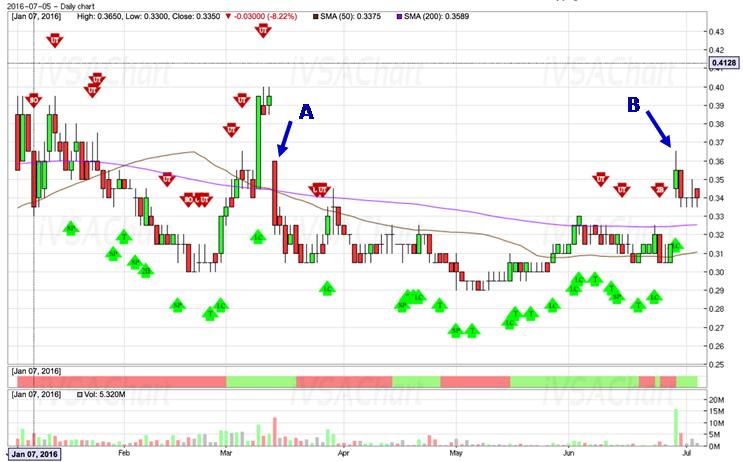
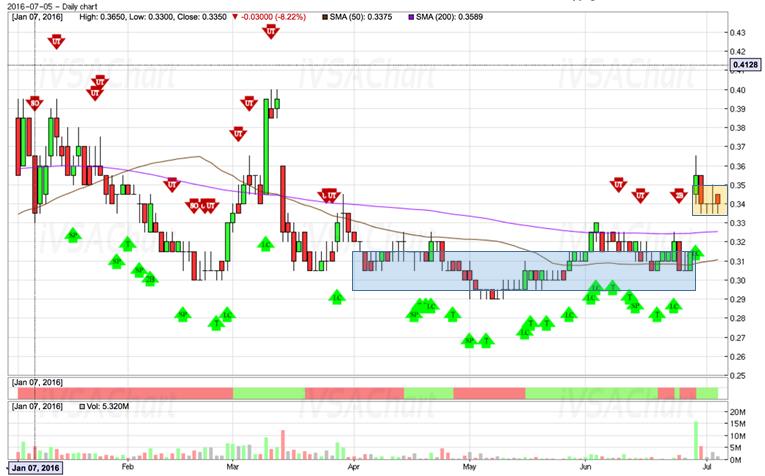
Identify Smart Money Movements
As discussed in previous “iVSA Article 6 - How to Detect Smart Money Movement” http://klse.i3investor.com/blogs/ivsatradingtipsandplans/96519.jsp, chart reading is the only way to identify the various market stages which are Accumulation, Mark Up, Distribution and Mark Down. By using the same chart above as an example, a winning trader or investor will take position during accumulation stage (shaded in blue) and sell during distribution stage (shaded in orange).
Back Testing
The importance of back testing your trading or investment plan was discussed in previous “iVSA Article 9 - Back Testing your Trading Plan” http://klse.i3investor.com/blogs/ivsatradingtipsandplans/97840.jsp. Back testing are mostly done through chart reading as historical price movement patterns are important to test your trading plan.
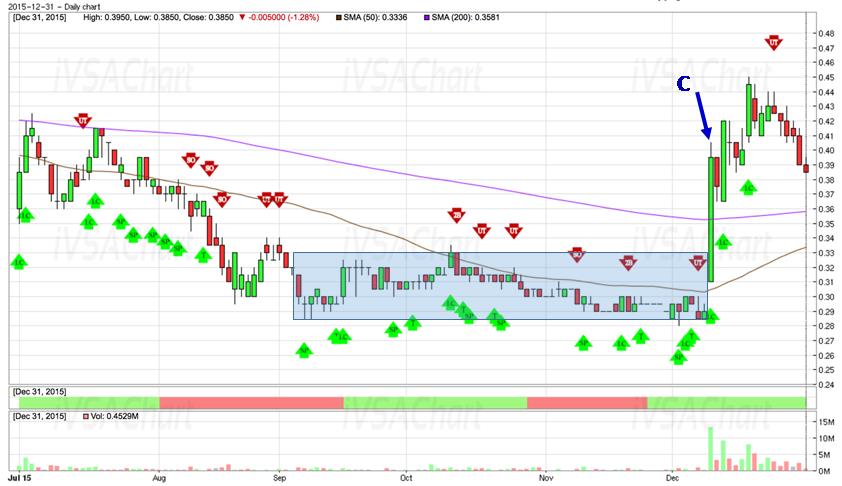
Using the same stock as both examples above, if a winning trader or investor wants to place a position during accumulation phase and anticipate that there will be a jump in price when quarterly announcement is made, he can back test and find out whether there are such cases occurred before in history.
The timeframe of the chart below is for the period of 6-months prior to the timeline of both above charts. True enough, this has happened earlier at point C whereby there is a price spike once a good quarterly results announcement is made. Moreover, do note that prior to the price spike there is also an accumulation phase (shaded in blue).
Identify Resistance and Support
Resistance and Support are a good way to estimate roughly the top or bottom of a stock price movement. A resistance level is simply an imaginary line at a price whereby a stock can’t seem to break higher whereas a support level is an imaginary line at a price whereby a stock can’t seem to drop below.
It is not impossible for a stock to breakthrough resistance level or drop below support level, it simply needs related level of volume for it to happen. A winning trader or investor can make use of the pre identified resistance level to gauge the likely peak of an upward movement and hence sell as close to resistance level in order to maximise profit. Similarly, trader or investor would look to buy a stock close to its support line in order to get an entry price that is likely at its lowest position relative to current timeframe.
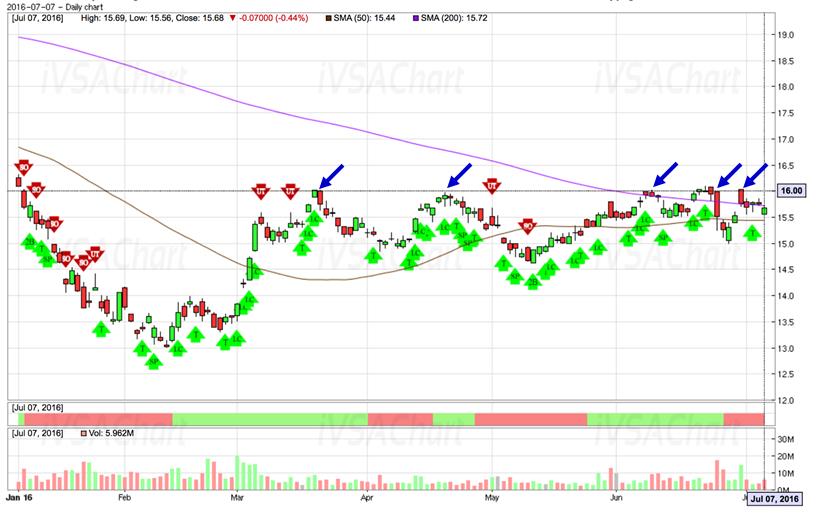
For example, the stock chart below shows a strong resistance at price around 16.00. The chart has shown that the stock price has touched 16.00 level and fail to break through it for 5 times (indicated by the arrows) within a 6-months period. Winning trader or investor can make use of this information and take partial or full profit when the stock price is closed to or hits 16.00 again as it is unlikely for it to breakthrough this resistance level unless there is appropriate level of volume accompanying it price movement.
Conclusion
As discussed above, there are plenty of useful information that can be derived through chart reading, provided that you have put in the efforts to acquire this lifetime skill. To be a successful, winning trader or investor, chart reading is a skill that must be acquired in order to stay informed and trade with an edge.
There are many methods of chart reading but one method is not necessary better than the other. It is important to stick to your preferred method, apply the knowledge on a regular basis in order to sharpen your skill overtime. Avoid switching methods too often as this will cause confusion and undermine the focus of your analysis. Remember this – “Trade with what you see in the chart, not with your heart”.
Watch out for next article in this series of education articles brought to you by iVSAChart, “Article 15 – Analysing Company Performance” under Series C: A Winning Strategy.
Interested to learn more?
- Join our Investment & Market Outlook Conference on 28th Aug 2016. Find out more via: https://www.ivsachart.com/investconference2016.php
- Website: https://www.ivsachart.com/events.php
- Email: sales@ivsachart.com
- WhatsApp: +6011 2125 8389/ +6018 286 9809
- Follow & Like us on Facebook: https://www.facebook.com/priceandvolumeinklse/
This article only serves as reference information and does not constitute a buy or sell call. Conduct your own research and assessment before deciding to buy or sell any stock. If you decide to buy or sell any stock, you are responsible for your own decision and associated risks.
More articles on iVSA Trading Tips and Plans
iVSA Article 19 - Ten Challenges and Opportunities in Stock Market
Created by Joe Cool | Sep 29, 2016
iVSA Article 16 - Importance of Market Structure & How to Identify Them
Created by Joe Cool | Jul 30, 2016
Discussions
3 people like this. Showing 11 of 11 comments
but dont forget that those chart can be artificially made as well by the smartmoney
2016-07-10 23:29
Chart is reaction. Controller do action. All charts can be pre designed if they want. Chart never tell lies but also never give true meaning 100%
2016-07-11 00:04
Posted by duitKWSPkita > Jul 11, 2016 12:04 AM | Report Abuse
Chart is reaction. Controller do action. All charts can be pre designed if they want. Chart never tell lies but also never give true meaning 100%
This is more rational lah.
2016-07-11 08:52
While attending a seminar given by a large Singapore broker firm, I learnt from one dealer saying that it cost at least S$150,000 to raise one point in price. So you must have deep pocket to manipulate the stock price, which will reflect in the chart. Who are these people having so much money to manipulate the price ... these are what we call Smart Money, and iVSAChart is capable to identify such Smart Money in action.
2016-07-12 12:22
A big price spike upwards or downwards usually means something significant has happened to the company and definitely worth noting as it represents a great opportunity for winning traders and investors. One of the most common cause of spikes are company’s quarterly result announcements.
The above show nothing readers also learn noting, because after the event every 1 know teaching should teach how to read from chart before the event mean knew it before POINT A out and also feel it before POINT B was out , not after sell or bought then the result out WHAT THE USE that is 事后孔明
2016-07-18 10:14
I respect good and useful article not an article which many people know yet tell after the event.If can show here something before the event tghat is great.
2016-07-18 10:19
Just to add to the above, chart reading is a very useful part of our analysis. While the charts of some stocks can be engineered, it cant be done for all stocks. And its almost impossible to engineer a chart over long periods of time.
But given the downside of charts, i.e. the concern of an engineered chart, it is nonetheless a very useful tool as the benefits of chart reading far outweighs the downside. However, its important to know that Chart reading, as in TA, is not the holy grail to trading. They must be analyzed in totality. Even so, we must accept that in spite of all our analysis, even if we complement it with FA analysis, we may still be wrong in our assessment. In this eventuality, we must have an exit strategy which forms part of our trading plan.
2016-07-18 10:50
@Smallworld, It is not fixed. it depends on the liquidity of the underlying security. You don't need a 150k to move an illiquid penny stock.
2017-06-03 20:52
Cannot depend totally on charts. Sometimes its more confusing. Strong momentum but RSI or Williams can point south!!! Or the candlesticks show differently. It takes time to know the characteristics and behavior of the counters over time.Anyway use it as a guide.
2017-06-03 23:24
Post a Comment
Featured Posts
Introducing MY's First IPO Fund for Sophisticated Investors!
New Update. Discover investment communities that resonate with your ideas
M & A Value Partners IPO Equity Fund has been launched - Targeted 13% Return p.a
Latest Videos


Apps


Top Articles
1
THE INVESTMENT APPROACH OF CALVIN TAN
US 60% TARIFF ON CHINA: CHINA FDI INTO MALAYSIA & INDONESIA WILL BENEFIT THESE STOCKS, Calvin Tan
2
Initial Public Offering (IPO)
3
Kenanga Research & Investment
Technology - Export Restrictions and Tariff Threats (OVERWEIGHT)
4
Mercury Securities Research
5
Mercury Securities Research
6
RHB Investment Research Reports
7
Good Articles to Share
Tariff policy done well can help grow the economy, GOP senator says
8
PublicInvest Research
#
Stock
Score
Daily Stocks
Stock Name
Last
Change
Volume
Stock Name
Last
Change
Volume
Stock Name
Last
Change
Volume
MQ Trading Signals
Stock
Time
Signal
Duration
Stock
Time
Signal
Duration
Featured Advertisers / Partners


Ride The Bull Short The Bear
CS Tan
4.9 / 5.0
This book is the result of the author's many years of experience and observation throughout his 26 years in the stockbroking industry. It was written for general public to learn to invest based on facts and not on fantasies or hearsay....
Smallworld
Beware of the News and trust your chart.
The chart never lies if been taught to read it correctly.
2016-07-10 21:52