


Kenanga Research & Investment
Daily Technical Highlights – LATITUD | SAM

Downside-bias trading still likely
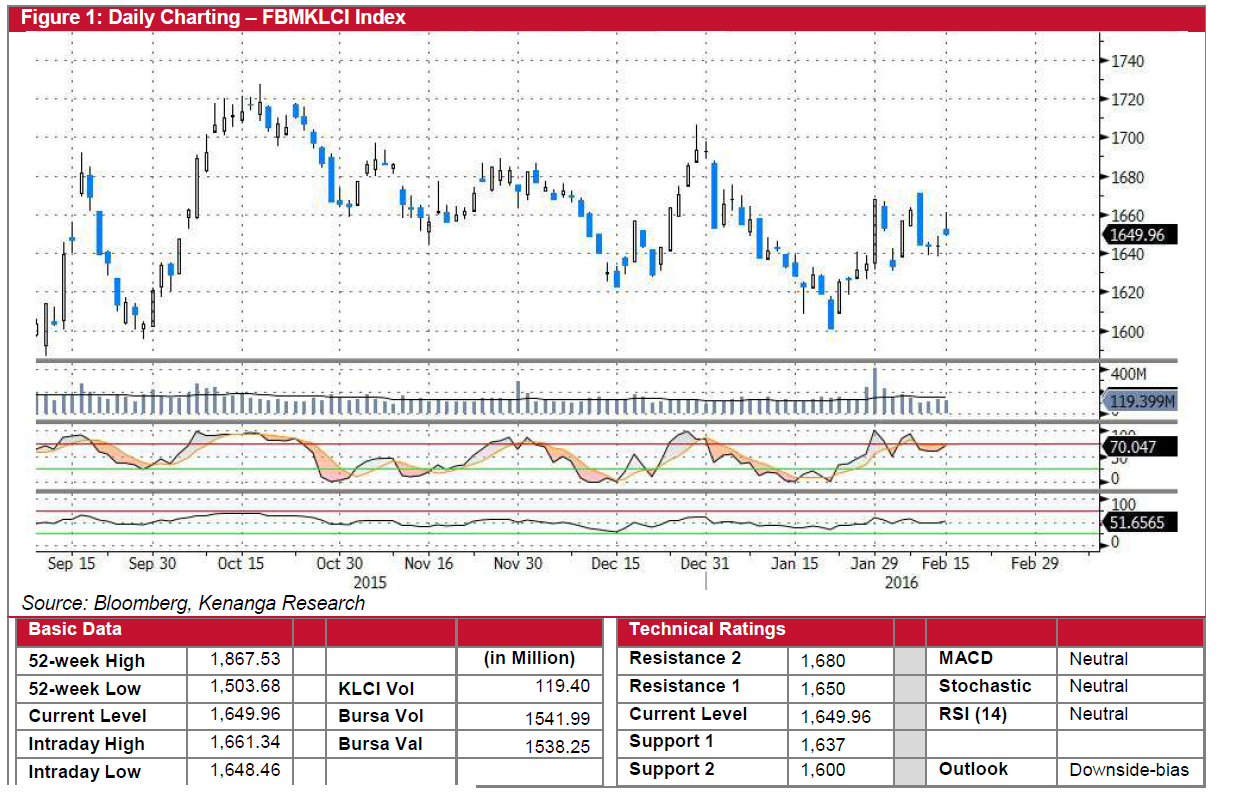
The FBMKLCI rose 6.22 points (+0.378%) to close at 1,649.96 yesterday, lifted mainly by selected blue chips such as ASTRO (+2.24%), SKPETRO (+1.67%), and CIMB (+1.43%). It seems that trading activity has yet to emerge after the prolonged Chinese New Year holidays as trading volume was rather lacklustre. On the daily chart, the local bourse remained on its sideways trajectory in tandem with all its key SMAs. Both MACD and RSI are still depicting a flattish tone, while Stochastic is in its overbought zone. This reinforces our weekly view that the benchmark index could poise for a downside-bias consolidation in the near-term. Hence, we reiterate our view that the FBMKLCI would likely trend on a downside-bias trajectory with
immediate support remained at 1,625 (S1) and 1,600 (S2). Resistance are marked at 1,665 (R1) and 1,700 (R2) respectively.
FBM Small Caps to continue lacklustre trading
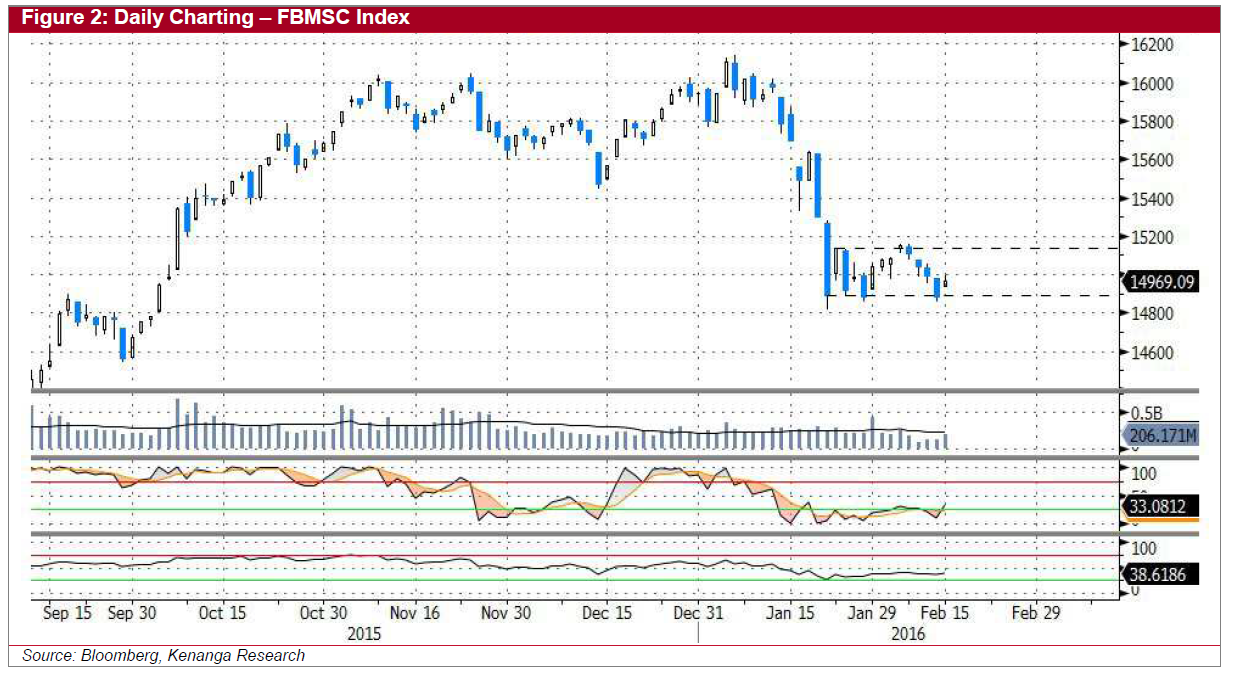
The FBMSC index has been trading sideways over the past two weeks on the back of lacklustre trading volume as investors went into a holiday mood for the long Chinese New Year break. It seems that the FBMSC has managed to find strong support at the 14,890 (S1) level after its recent sell-down since the start of the year. Yesterday, the index rose just 82.29 points (0.5%) to close at 14,969.09. Technically speaking, the index is expected to trade range bound between 14,890 (S1) – 15,150 (R1) in the near-term underpinned by the flattish RSI and Stochastic, with the latter still in its oversold region. While we anticipate buying activities to return gradually post the holiday break this week, rebound play will likely be limited at the 15,150 level. Next level support and resistance are seen at 14,500 (S2) and 15,500 (R2) respectively.
Daily technical highlights
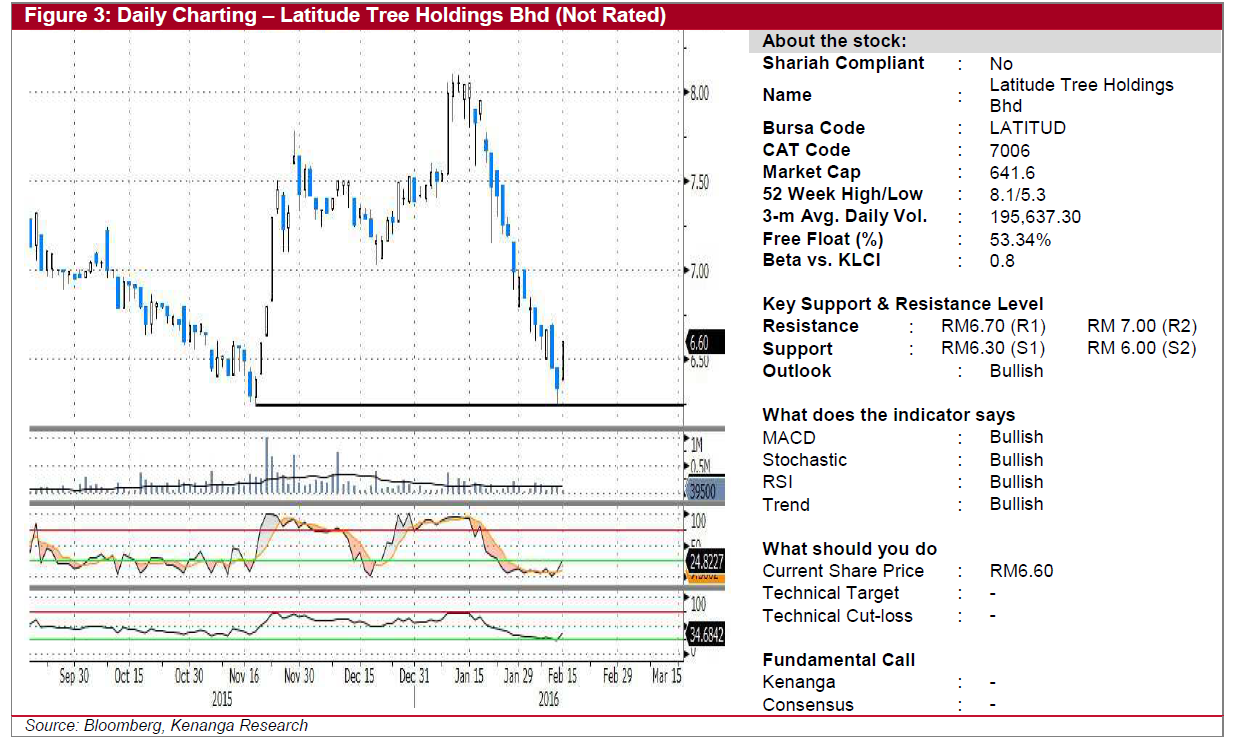
· LATITUD (Not Rated). LATITUD has been undergoing a significant sell-down by investors since reaching a high level of RM8.05 on 12 Jan 2016. Following the recent decline, the share price seems to have found its footing near its key support level of RM6.30 (S1). Yesterday, the share price rose 0.26 sen (4.1%) to RM6.60 albeit on a lower trading volume. Despite the lower trading volume, strong upticks seen in Stochastic and RSI indicator are indicating that a rebound play could be in the making. Taking a more conservative approach, we advocate interested investors to look out for a strong volume follow-through buying before entering stock. Meanwhile, investors should also be alert of any decisive breakdown from the S1 level, where further downside could be seen at the RM6.00 (S2) if the breakdown occurs.
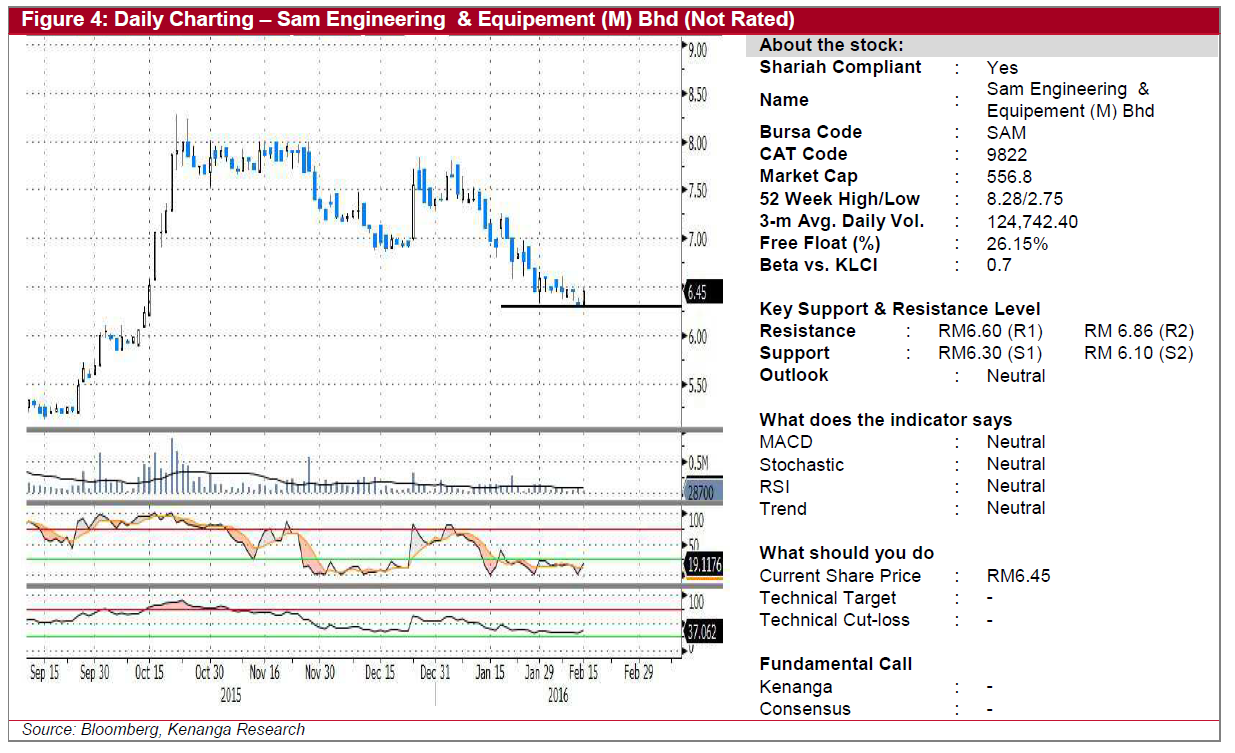
· SAM (Not Rated). SAM has been on a short-term downtrend since the start of year 2016 after failing to break the RM7.80 level back then. Trading volume has also been declining over the past month, also seen when the share price climbed 13.0 sen (2.06%) to settle higher at RM6.45 yesterday. From a technical stand point, the share price seems to be bottoming near the RM6.30 (S1) mark. Key momentum indicators such as Stochastic and RSI are also in their respective oversold state, suggesting downside could be limited from here. With that, we suggest investors to keep an eye for a potential strong volume rebound play in the near-term as a buy signal before entering the stock. Immediate resistance levels are capped at RM6.60 (R1) and RM6.86 (R2), while immediate support is set at RM6.30 (S1) and RM6.10 (S2).
Source: Kenanga Research - 16 Feb 2016
Related Stocks
| Chart | Stock Name | Last | Change | Volume |
|---|
More articles on Kenanga Research & Investment
Pharmaniaga - Better outlook at medical supply unit, PN17 Stays
Created by kiasutrader | Nov 27, 2024
Malaysia Airports Holdings - Buoyed by High-Yielding Passengers
Created by kiasutrader | Nov 27, 2024
Featured Posts
Introducing MY's First IPO Fund for Sophisticated Investors!
New Update. Discover investment communities that resonate with your ideas
M & A Value Partners IPO Equity Fund has been launched - Targeted 13% Return p.a
Latest Videos


Apps


Top Articles
1
Dragon Leong blog
2
3
THE INVESTMENT APPROACH OF CALVIN TAN
4
5
THE INVESTMENT APPROACH OF CALVIN TAN
JAYA TIASA (4383) WAS 71.5 SEN REPOSTING THIS PALM OIL JEWEL & LATEST UPDATES, Calvin Tan
6
Follow Kim's Stockwatch!
7
CEO Morning Brief
8
RHB Investment Research Reports
#
Stock
Score
Daily Stocks
Stock Name
Last
Change
Volume
Stock Name
Last
Change
Volume
Featured Advertisers / Partners


Ride The Bull Short The Bear
CS Tan
4.9 / 5.0
This book is the result of the author's many years of experience and observation throughout his 26 years in the stockbroking industry. It was written for general public to learn to invest based on facts and not on fantasies or hearsay....