


Kenanga Research & Investment
Daily Technical Highlights – HOHUP | SAM

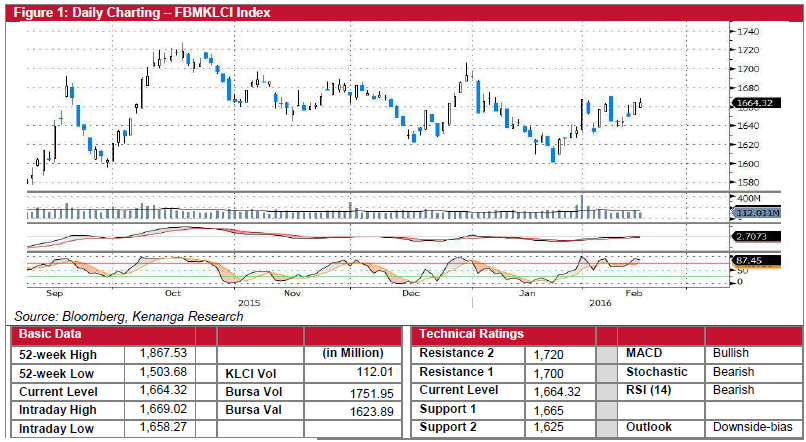
FBMKLCI loses momentum
In tandem with the slip in regional markets’ performance, the FBMKLCI erased its earlier gains to end marginally lower by only 0.67 points (-0.04%) at 1,664.32. Most of the Asian markets made a U-turn during mid-day after China released a lower guidance rate for the Yuan, despite a rally seen in Crude oil prices. The market breadth of the FBMKLCI was rather balanced, but with losers picking up pace after the noon break to break even with the bulls by 427 counters against 407 counters respectively. Looking at its technical picture, the FBMKLCI maintained its sideways trajectory to settle just marginally above its 1,665 support level. MACD had turned flattish, while RSI and Stochastic have started to show signs of rolling over (with the latter reversing from its overbought zone). This suggests that the recent uptrend by the local bourse could possibly be short-lived and a consolidation play could well be on the cards. Hence, we maintained our weekly view that the benchmark index could be capped around the 1,665 level and consolidate soon with immediate support seen at 1,625 (S1) and 1,600 (S2) respectively.
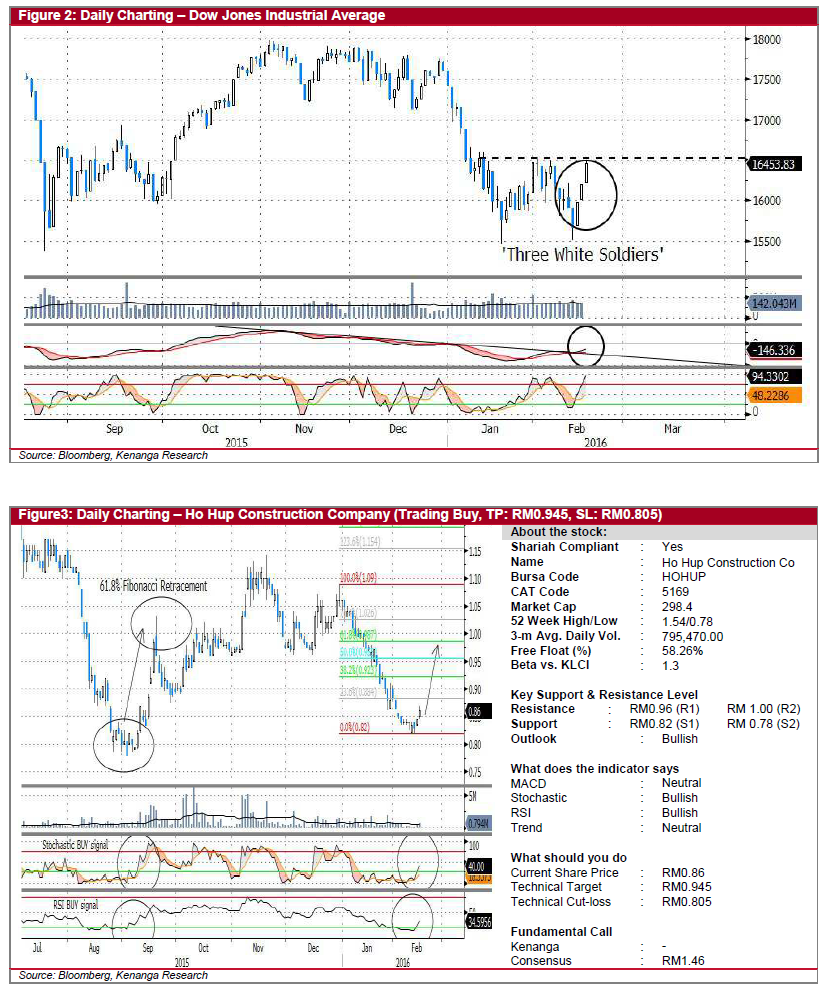
Hat trick by Wall Street
On the back of the swift rebound seen in Crude oil prices to USD34.50/barrel last night, Wall Street posted its third consecutive gains with the Dow climbing another 257.42 points (1.59%) to close at 16,453.83. US stocks were also boosted by the Fed's minutes release which showed that policymakers are considering changes in their interest rate hike plans in 2016 considering the global economic woes. From a technical perspective, the Dow has formed a ‘Three White Soldiers’ candlestick chart pattern to showcase the shift in bullish momentum from its recent consolidation.
MACD has also staged a bullish convergence, breaking out from its downtrend resistance line. Besides, a strong uptick seen in the Stochastic indicator is also depicting an influx of buying strength in the market albeit venturing into its overbought levels soon. Near-term outlook by the benchmark index looks promising as shown by the indicators above, as the Dow will be looking to retest its immediate resistance level of 16,500 (R1) whereby a decisive breakout could lead the key index to resume its uptrend trajectory. Nevertheless, should it fail to stage a convincing breakout, the Dow might possibly be caught in a congestion zone within 15,500 (S2) – 16,500 (R1).
Daily technical highlights
· HOHUP (Trading Buy, TP: RM0.945). In the sell-off over the past two months, HOHUP saw its share price retreating from a high of RM1.09 to last week’s low of RM0.82. Nevertheless, the share price appears to have marked a bottom and is poised for a short-term technical rebound. The share price closed at RM0.86 yesterday, up by 1.5 sen (+1.8%). With yesterday’s bullish move, both the Stochastic and RSI indicators have turned upwards from oversold levels to reflect a pick-up in buying activities. Of note, the current technical picture bears a strong resemblance to the previous sell-down and subsequent strong rebound during the Aug-Sep 2015 period (see chart). Should history serve as a guide, we would expect HOHUP to retrace around 61.8% of its recent downward move towards the RM0.96-RM1.00 resistance. For this trading strategy, traders should aim to take profit at RM0.945 (3 bids below RM0.96 resistance), while setting a protective stop-loss of RM0.805 (3 bids below RM0.82 support).
· SAM (Not Rated). Recall two days ago (16-Feb) when we reviewed SAM as we spotted a potential rebound play by the precision machining and automation solutions player from its strong support level of RM6.30 (S2). Since then, the share price has garnered investors’ interest to rebound from its strong support level of RM6.30 (S2) to rally 27.0 sen (4.09%) to settle above its 20-day SMA level at RM6.87 yesterday. The outlook had turned bullish-bias as the MACD had staged a bullish crossover to undergo a bullish convergence, breaking out from its downtrend resistance. Buying momentum is also seen to lay a supportive hand on the bullish trend as depicted by the strong uptick seen in the Stochastic. From here, we expect the share price to climb towards its immediate resistance level of RM6.86 (R1) before its channel resistance level of RM7.50 (R2). Immediate support can be found at RM6.74 (S1) and RM6.30 (S2). Interested investors could target to take profit at RM7.47 (3 bids below RM7.50 resistance) while placing a strict stop-loss at RM6.27 (3 bids below RM6.30 support).
Source: Kenanga Research - 18 Feb 2016
Related Stocks
| Chart | Stock Name | Last | Change | Volume |
|---|
More articles on Kenanga Research & Investment
Pharmaniaga - Better outlook at medical supply unit, PN17 Stays
Created by kiasutrader | Nov 27, 2024
Malaysia Airports Holdings - Buoyed by High-Yielding Passengers
Created by kiasutrader | Nov 27, 2024
Discussions
Be the first to like this. Showing 0 of 0 comments
Post a Comment
Featured Posts
Introducing MY's First IPO Fund for Sophisticated Investors!
New Update. Discover investment communities that resonate with your ideas
M & A Value Partners IPO Equity Fund has been launched - Targeted 13% Return p.a
Latest Videos


Apps


Top Articles
1
Dragon Leong blog
2
3
THE INVESTMENT APPROACH OF CALVIN TAN
4
5
THE INVESTMENT APPROACH OF CALVIN TAN
JAYA TIASA (4383) WAS 71.5 SEN REPOSTING THIS PALM OIL JEWEL & LATEST UPDATES, Calvin Tan
6
Follow Kim's Stockwatch!
7
CEO Morning Brief
8
RHB Investment Research Reports
#
Stock
Score
Daily Stocks
Stock Name
Last
Change
Volume
Stock Name
Last
Change
Volume
Featured Advertisers / Partners


Ride The Bull Short The Bear
CS Tan
4.9 / 5.0
This book is the result of the author's many years of experience and observation throughout his 26 years in the stockbroking industry. It was written for general public to learn to invest based on facts and not on fantasies or hearsay....