


Kenanga Research & Investment
Daily technical highlights – (FLEXI, POHKONG)

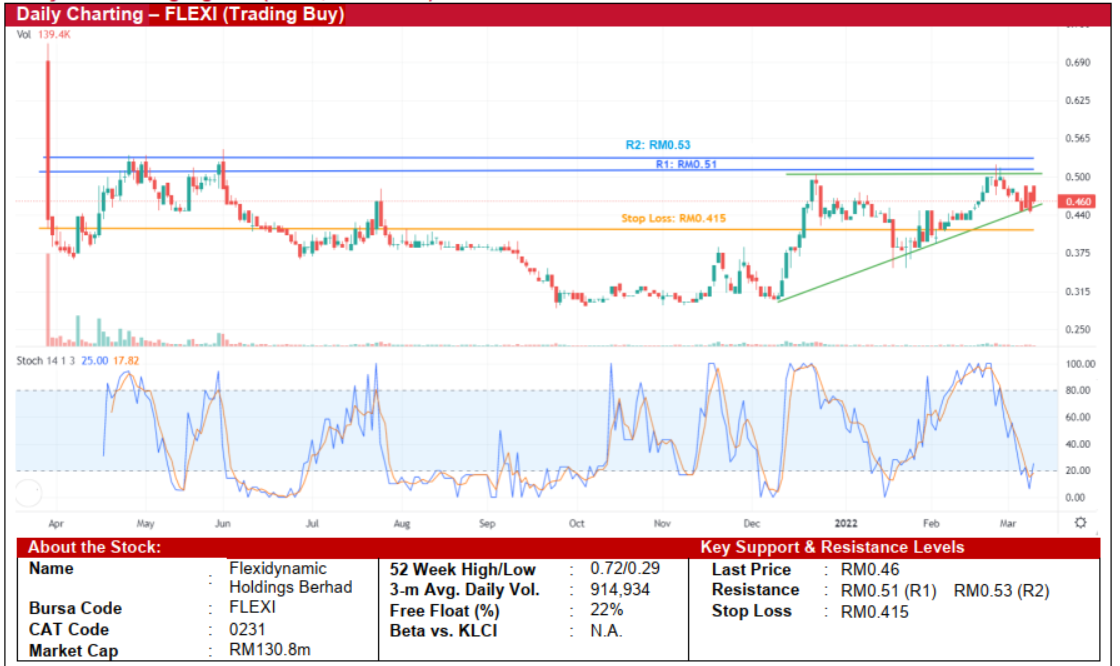
Flexidynamic Holdings Bhd (Trading Buy)
• Chart-wise, following the occurrence of two peaks in April 2021 and June 2021 at a price of RM0.53, FLEXI shares subsequently slipped by 45% to a low of RM0.29 before moving in a sideways pattern which was halted in mid-December 2021. The stock then formed an ascending triangle, plotting higher lows along the way.
• A technical breakout is likely to occur as the stock has been gliding above the ascending trendline (which indicates rising buying interest) while the recent crossover by the stochastic indicator’s %K above the %D in the oversold region signals a positive bias in the share price.
• Thus, the stock could rise to challenge our resistance levels of RM0.51 (R1; 11% upside potential) and RM0.53 (R2; 15% upside potential).
• We have pegged our stop loss at RM0.415, which represents a downside risk of 10%.
• FLEXI is in the business of designing, engineering, installation and commissioning of glove chlorination systems for the glove manufacturing industry with a worldwide customer base.
• Earnings-wise, the group’s revenue rose by 86% to RM105.8m in FY21 from RM56.9m in FY20, thanks to the group’s customers ramping up expansion plans to meet higher glove demand.
• Nonetheless, the group recorded a lower core net profit of RM3.3m in FY21 from a core net profit of RM4.5m (-28%) due to one-off expenses incurred in FY21 (arising from the listing expense of RM2.4m and payment expense of RM0.7m following the implementation of Employee’s Share Options Scheme in December 2021).
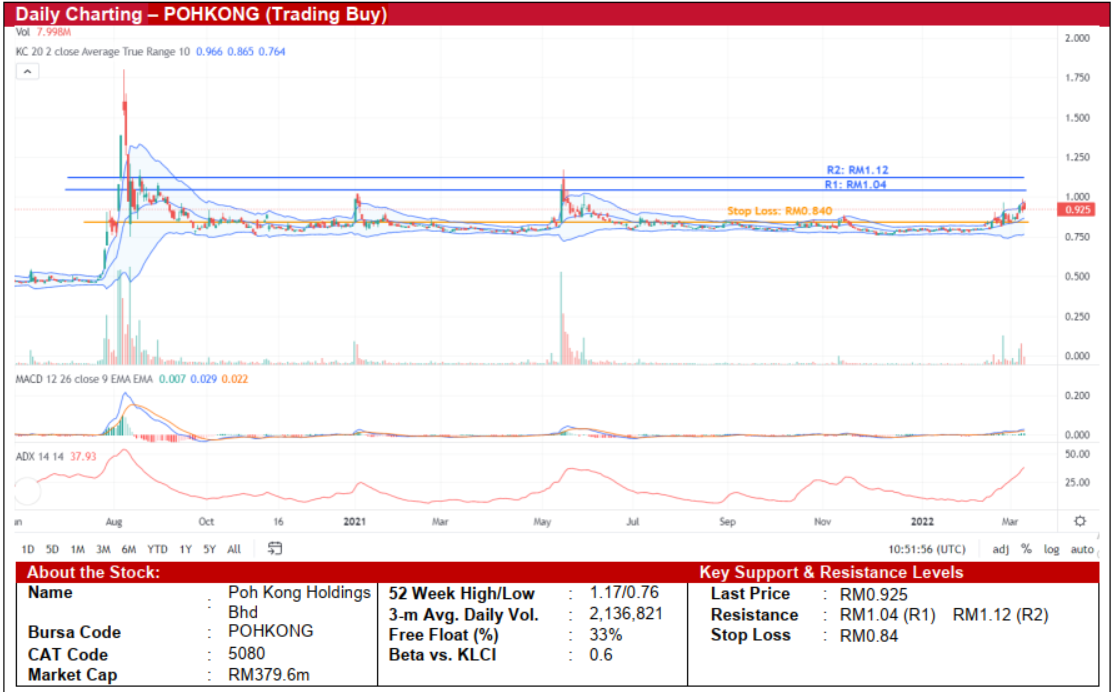
Poh Kong Holdings Bhd (Trading Buy)
• Chart-wise, after hitting a peak of RM1.80 in early August 2020, POHKONG shares trended downwards before moving sideways from mid-September 2020 to mid-February 2022. Recently, interest in the stock has picked up following a breakout (that was backed by higher-than-average trading volume) from the consolidation pattern.
• Based on the Keltner Channel signal, the stock price is likely to strengthen further as the stock continues to hover around the upper boundary of the channel.
• With the MACD line crossing above the signal line and coupled with the ADX indicator trending upwards too, we expect the stock to climb and challenge our resistance levels of RM1.04 (R1; 12% upside potential) and RM1.12 (R2; 21% upside potential).
• On the downside, our stop loss has been set at RM0.84, which translates to a downside risk of 9%.
• Business-wise, the group is engaged in the manufacturing, trading, supplying and retailing of gold, gold-related jewelry and gems.
• For 1QFY22, the group recorded a revenue of RM175.3m, down 21% from RM221.9m in 1QFY21 as the group’s sales was affected by the gradual reopening of the economy in stages (from 16 August 2021). In line with the revenue drop, the group’s core net profit plunged to RM5.4m in 1QFY22 from RM14.6m in 1QFY21 (-63%).
• Moving forward, we believe the group stands to benefit from margins expansion arising from timing effects in view of the soaring gold price (which is now at its highest since January 2021), especially if the war in Ukraine prolongs.
Source: Kenanga Research - 10 Mar 2022
Related Stocks
| Chart | Stock Name | Last | Change | Volume |
|---|
More articles on Kenanga Research & Investment
Bond Weekly Outlook - MGS/GII likely to rise amid ongoing US economic resilience
Created by kiasutrader | Nov 22, 2024
Discussions
Be the first to like this. Showing 0 of 0 comments
Post a Comment
Featured Posts
Introducing MY's First IPO Fund for Sophisticated Investors!
New Update. Discover investment communities that resonate with your ideas
M & A Value Partners IPO Equity Fund has been launched - Targeted 13% Return p.a
Latest Videos


Apps


Top Articles
1
2
Koon Yew Yin's Blog
CPO price is rising rapidly as shown by chart below - Koon Yew Yin
3
4
Axcapital's investment blog
KAB - Executing its way to a record quarter. Could more Petronas contracts be coming?
6
save malaysia!
Visa-free travel to China extended for Malaysians to 30 days
7
8
#
Stock
Score
Daily Stocks
Stock Name
Last
Change
Volume
Stock Name
Last
Change
Volume
Stock Name
Last
Change
Volume
Featured Advertisers / Partners


Ride The Bull Short The Bear
CS Tan
4.9 / 5.0
This book is the result of the author's many years of experience and observation throughout his 26 years in the stockbroking industry. It was written for general public to learn to invest based on facts and not on fantasies or hearsay....