


Kenanga Research & Investment
Weekly Technical Highlights – FBM KLCI

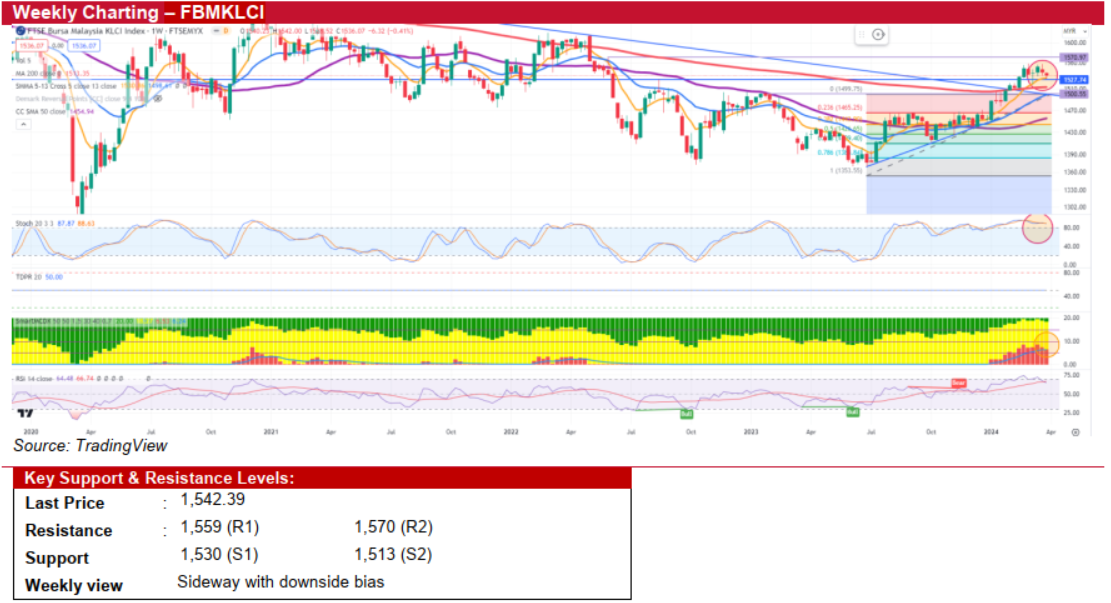
FBM KLCI (Sideways with upward bias)
- The FBM KLCI ended last week softer, dropping 6.32 points or 0.41% WoW to 1,536.07. Throughout March, foreign investment flows, which turned net sellers after being net buyers in the initial months of the year, significantly influenced the index's trajectory. Despite various challenges, including a slump in some small-cap stocks, a 2.9% depreciation of the MYR against the USD, and continuous foreign outflows in March, the index still achieved an impressive gain of 87.73 points or 5.6% in 1QCY24.
- The market is expected to remain relatively quiet this week, continuing in a sideways consolidation pattern due to a lack of new corporate and economic data. Focus remains on any new economic data that could influence US interest rate cut decisions, the forthcoming 1QCY24 US corporate earnings, and the direction of foreign fund flows. These factors are key to gauging market momentum in the near term.
- Technically, the FBM KLCI experienced a healthy pullback last week and yet remained above its 5-week SMA, indicating the upward trend is still in play despite the MCDX and RSI indicators showing a downtrend. While the index may test the shortterm SMA support at 1,530 again, it's expected to stay robust till week's end. A re-evaluation of our bullish stance will only occur if there's a clear break below the 200-week SMA at 1,513.
- In short, we expect the market to persist in its sideways trading pattern this week, albeit with a downward tilt. Immediate support levels are pegged at 1,530 and 1,513. Conversely, resistance levels are seen at 1,559 and 1,570.
Source: Kenanga Research - 1 Apr 2024
Related Stocks
| Chart | Stock Name | Last | Change | Volume |
|---|
Market Buzz
More articles on Kenanga Research & Investment
Weekly Technical Highlights – Dow Jones Industrial Average (DJIA)
Created by kiasutrader | Jan 20, 2025
Renewable Energy - Big News, Another 2GW LSS Incoming (OVERWEIGHT)
Created by kiasutrader | Jan 20, 2025
Bond Market Weekly Outlook - Domestic yields set to rise ahead of Trump’s inauguration
Created by kiasutrader | Jan 17, 2025
Discussions
Be the first to like this. Showing 0 of 0 comments
Post a Comment
Featured Posts


Latest Videos


Apps


Top Articles
1
Mercury Securities Research
2
HLBank Research Highlights
3
RHB Investment Research Reports
Market Strategy - Data Centre-Artificial Intelligence Party Pooper
4
RHB Investment Research Reports
5
PublicInvest Research
6
HLBank Research Highlights
7
Mercury Securities Research
8
Kenanga Research & Investment
Renewable Energy - Big News, Another 2GW LSS Incoming (OVERWEIGHT)
#
Stock
Score
Daily Stocks
Stock Name
Last
Change
Volume
Stock Name
Last
Change
Volume
Stock Name
Last
Change
Volume
Featured Advertisers / Partners


Ride The Bull Short The Bear
CS Tan
4.9 / 5.0
This book is the result of the author's many years of experience and observation throughout his 26 years in the stockbroking industry. It was written for general public to learn to invest based on facts and not on fantasies or hearsay....