


Kenanga Research & Investment
Daily Charting - EFRAME (Technical Buy)

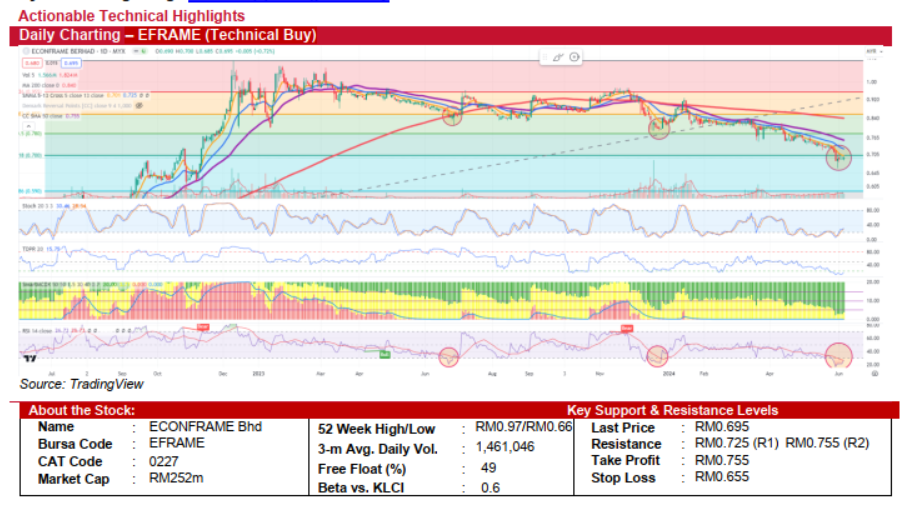
ECONFRAME BERHAD (Technical Buy)
- Econframe Bhd (EFRAME) closed at RM0.695 last Friday after consolidating and stabilizing around the RM0.68 zone over the past few trading days. The recent session featured a ‘Doji’ candlestick pattern, indicating indecisiveness and a possible trend reversal. The weekly chart mirrors this pattern, suggesting a potential bullish shift ahead.
- From a technical perspective, the Tom Demark Pressure Ratio (TDRP) at 15.75 suggests diminishing selling pressure. The daily RSI, in the oversold zone at 26.73, reinforces the likelihood of a bullish turn-around based on historical trends. The weekly chart also displays similar indicators, further supporting a potential bullish shift.
- A sustained move above the immediate resistance level of RM0.70 could signal a bullish trend, leading the stock to test higher resistance levels at RM0.725 and RM0.755. Conversely, a decline below the RM0.680 support level may indicate a continuation of the downtrend towards the next major support at RM0.66. The "Doji" pattern suggests market indecision, which, if followed by a bullish candle, could confirm a trend reversal.
- We recommend considering an entry position around the RM0.69 to RM0.70 range. Setting a take-profit target at RM0.755 provides an estimated upside potential of approximately 9.4%. For risk management, placing a stop-loss at RM0.655 limits potential downside to around 5.1%. This strategy offers a balanced risk-to-reward ratio, making it a viable trade setup for investors.
Source: Kenanga Research - 10 Jun 2024
Related Stocks
| Chart | Stock Name | Last | Change | Volume |
|---|
More articles on Kenanga Research & Investment
Weekly Technical Highlights – Dow Jones Industrial Average (DJIA)
Created by kiasutrader | Jan 20, 2025
Renewable Energy - Big News, Another 2GW LSS Incoming (OVERWEIGHT)
Created by kiasutrader | Jan 20, 2025
Bond Market Weekly Outlook - Domestic yields set to rise ahead of Trump’s inauguration
Created by kiasutrader | Jan 17, 2025
Discussions
Be the first to like this. Showing 0 of 0 comments
Post a Comment
Featured Posts
Introducing MY's First IPO Fund for Sophisticated Investors!
New Update. Discover investment communities that resonate with your ideas
M & A Value Partners IPO Equity Fund has been launched - Targeted 13% Return p.a
Latest Videos


MQ Trading Signals
Time
Signal
Duration
Type
2025-01-21 09:20:00
ADX
10 Mins
SELL
2025-01-21 09:20:00
ADX
5 Mins
SELL
2025-01-21 09:00:00
ADX
30 Mins
BUY
2025-01-21 09:00:00
ADX
10 Mins
BUY
2025-01-21 09:00:00
ADX
5 Mins
BUY
Apps


Top Articles
1
Mercury Securities Research
2
HLBank Research Highlights
3
RHB Investment Research Reports
Market Strategy - Data Centre-Artificial Intelligence Party Pooper
4
RHB Investment Research Reports
5
PublicInvest Research
6
HLBank Research Highlights
7
Mercury Securities Research
8
Kenanga Research & Investment
Renewable Energy - Big News, Another 2GW LSS Incoming (OVERWEIGHT)
#
Stock
Score
Daily Stocks
Stock Name
Last
Change
Volume
Stock Name
Last
Change
Volume
Stock Name
Last
Change
Volume
Featured Advertisers / Partners


Ride The Bull Short The Bear
CS Tan
4.9 / 5.0
This book is the result of the author's many years of experience and observation throughout his 26 years in the stockbroking industry. It was written for general public to learn to invest based on facts and not on fantasies or hearsay....