Kenanga Research & Investment
Actionable Technical Highlights – (INARI BHD)
kiasutrader
Publish date: Tue, 24 Sep 2024, 03:33 PM
INARI BERHAD (Technical Buy)
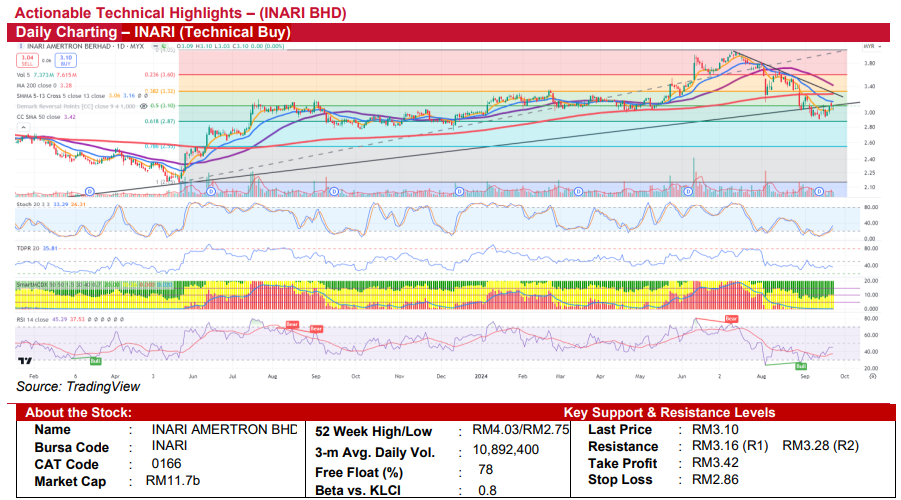
- Inari Amertron Berhad (INARI) closed at RM3.10 yesterday, unchanged from the previous session. The stock is trading near its 5-day Simple Moving Average (SMA) of RM3.06, with improving traded volume. Additionally, the stock has bounced from the 61.8% Fibonacci retracement level of RM2.87, indicating solid support within the RM2.87-RM3.10 range.
- Technically, the stochastic oscillator shows early signs of trending upwards from oversold territory, signalling renewed buying interest. The Tom Demark Pressure Ratio (TDRP) remains stable at 35.81, reflecting balanced market activity. The RSI has broken above its 14-day SMA and continues to rise, suggesting strengthening bullish momentum. The weekly chart supports this outlook, with the weekly stochastic indicator also moving upward from oversold conditions.
- Key levels to watch include immediate resistance at RM3.16, aligned with the 13-day SMA. A break above this level could push the stock toward RM3.28, coinciding with the 200-day SMA, and potentially to RM3.32, which aligns with the 38.2% Fibonacci retracement level. On the downside, strong support is at RM3.06 (5-day/200-week SMA) and RM3.00, providing a firm foundation against further declines.
- Based on these bullish indicators and the likelihood of continued upward momentum, we recommend considering an entry at RM3.10. A take-profit target at RM3.42, coinciding with the 50-day SMA, offers a potential upside of approximately 10.3%. For risk management, placing a stop-loss at RM2.86 limits downside risk to around 7.7%. This strategy presents a favorable risk-toreward ratio, making INARI an attractive opportunity for near-term gains.
Source: Kenanga Research - 24 Sept 2024
Related Stocks
| Chart | Stock Name | Last | Change | Volume |
|---|
More articles on Kenanga Research & Investment
Weekly Technical Highlights – Dow Jones Industrial Average (DJIA)
Created by kiasutrader | Jan 20, 2025
Renewable Energy - Big News, Another 2GW LSS Incoming (OVERWEIGHT)
Created by kiasutrader | Jan 20, 2025
Bond Market Weekly Outlook - Domestic yields set to rise ahead of Trump’s inauguration
Created by kiasutrader | Jan 17, 2025
Discussions
Be the first to like this. Showing 0 of 0 comments


