AWC (7579) - Testing New All-time High?
MercurySec
Publish date: Mon, 22 Jul 2024, 09:43 AM
Technical Highlights
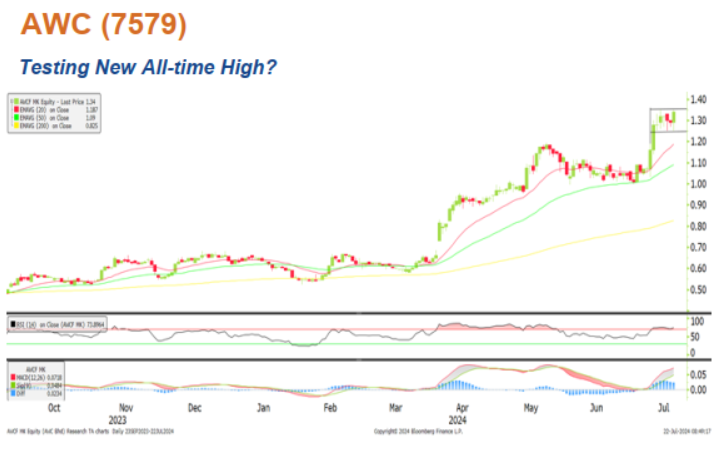
A past triangle pattern break-out had provided momentum for the share price of AWC to escalate substantially with the formation of a double large green candle recently. With the share price leaping last Friday with considerable momentum (RSI >70), this provided strong evidence that the breaking-out of the 2-week long flag formation pattern may be on the cards.
Short-term bullishness is affirmed by the upward-pointing 20-EMA line. Likewise, the momentum is favourable with the recent golden cross exhibited by the MACD.
If the share price breaks through the flag pattern and closes above RM1.35 (52-week high), we think the share could put the RM1.45 resistance (new all-time high) and subsequent RM1.54 resistance to the test (extracted based on the difference of RM0.10 between the high and low of the flag pattern). Conversely, consolidation happens if the share price dips below the RM1.08 support.
Entry – RM-1.34 – RM1.35
Stop Loss – RM1.07
Target Price – RM1.45 – RM1.55
Source: Mercury Securities Research - 22 Jul 2024
Related Stocks
| Chart | Stock Name | Last | Change | Volume |
|---|
More articles on Mercury Securities Research
Created by MercurySec | Jan 17, 2025


