Bahvest Resources (0098) - Upswing Continues?
MercurySec
Publish date: Mon, 05 Aug 2024, 09:33 AM
Technical Highlights
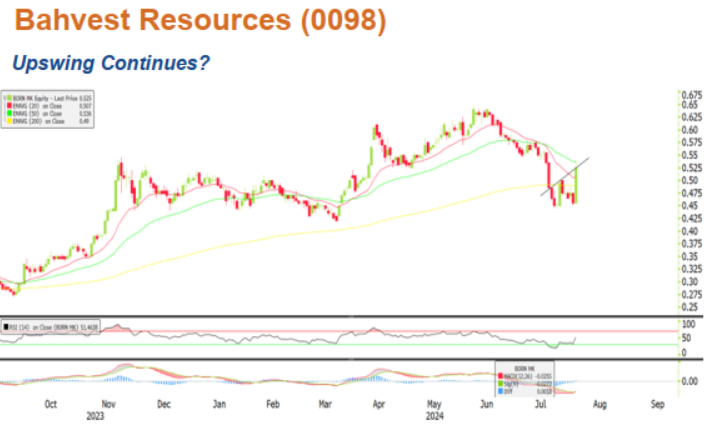
The stock had been hovering below all its EMA lines over the last few weeks. However, the surge with the formation of large green candle at closing last Friday provided the momentum for the share to trade above its 20-EMA line. Simultaneously, the green candle also broke through the 4-week long double bottom pattern with strong momentum (RSI is upticking). With these positive signals, we think that upswing potential may still be in play. . Last Friday, the MACD exhibited a golden cross, which denotes strong momentum going forward. Additionally, the upward-pointing 20-EMA line confirms its short-term bullishness.
Given the double bottom pattern break-out at RM0.505 neckline with momentum, we think the share could test the next resistance at RM0.550 first and subsequently at 0.595 resistance (determined by the difference of RM0.045 between the high and low of the double bottom pattern). Conversely, consolidation starts if the share price dips below the RM0.455 support.
Entry – RM-0.525 – RM0.530
Stop Loss – RM0.450
Target Price – RM0.550 – RM0.595
Source: Mercury Securities Research - 5 Aug 2024
Related Stocks
| Chart | Stock Name | Last | Change | Volume |
|---|
More articles on Mercury Securities Research
Created by MercurySec | Jan 17, 2025


