IGB REIT (5227) - Upticking Ahead?
MercurySec
Publish date: Wed, 07 Aug 2024, 09:16 AM
Technical Highlights
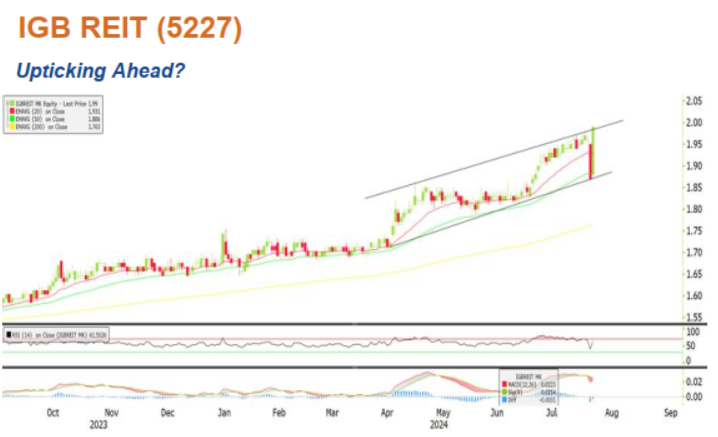
The stock had been experiencing upswing with a pattern of higher high and higher low for the past 2 months. However, the upticking momentum halted when share experienced significant selling pressure, leading to the share price plunged below its 20-EMA line recently. Despite a pullback from its previous 52-week high, the stock regained its momentum and rallied to close higher with another new 52-week high at RM1.99 yesterday. We see the upticking potential as healthy especially with a formation of green candle that broke through a 4-month-long ascending channel pattern with considerable trading volume (2.8x more than its average 90-day total trading volume).
Short-term bullishness is ascertained by upward pointing 20-EMA line and RSI line.
With these favorable indicators, we think IGB REIT’s share could potentially test the resistance at RM2.08 (new 52-week high) first and subsequently at RM2.18 (appertaining to the difference of RM0.10 between the high and low of the channel pattern). Conversely, a fall below RM1.87 could indicate the start of a correction phase.
Entry – RM-1.99 – RM2.00
Stop Loss – RM1.85
Target Price – RM2.085 – RM2.185
Source: Mercury Securities Research - 7 Aug 2024
Related Stocks
| Chart | Stock Name | Last | Change | Volume |
|---|


