Careplus Group (0163) - Potential Big Move Ahead?
MercurySec
Publish date: Tue, 20 Aug 2024, 12:41 PM
Technical Highlights
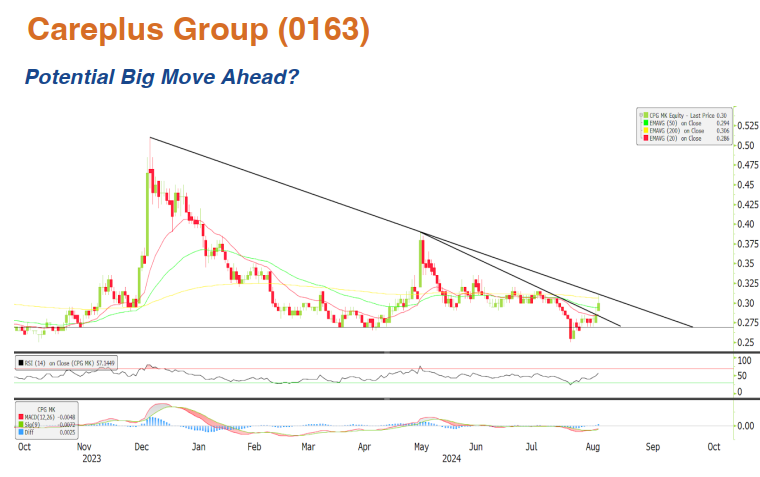
The stock is currently displaying a descending triangle pattern, where two trendlines are converging. Recently, it broke above the inner trendline, suggesting a potential shift from a sideways phase to an upward trend. Yesterday, the stock even reached the outer trendline with strong buying volume, indicating a test of this longer-term resistance. It is currently trading above the 20-day and 50-day EMAs and is close to the 200-day EMA. Momentum indicators are also signaling a possible upward move. The MACD has completed a golden cross, and the RSI is climbing upward, showing that buyers are starting to gain control as the stock recovers from oversold conditions. Looking ahead, if the price breaks through the outer trendline of the triangle, it could trigger another upward move. The first resistance level to watch is RM0.390, with the potential to reach near the 52-week high at RM0.470. However, if the price falls below RM0.250, it could invalidate the entire consolidation zone, signalling a possible correction phase.
Entry – RM0.290 – RM0.310
Stop Loss – RM0.250
Target Price – RM0.390 – RM0.470
Source: Mercury Securities Research - 20 Aug 2024
Related Stocks
| Chart | Stock Name | Last | Change | Volume |
|---|
More articles on Mercury Securities Research
Created by MercurySec | Jan 22, 2025


