HHRG (0175) Repeating History
MercurySec
Publish date: Thu, 22 Aug 2024, 10:05 AM
Technical Highlights
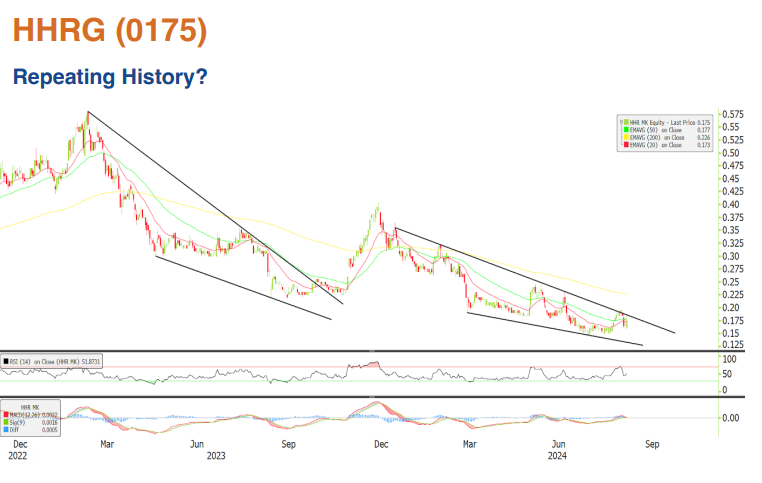
The stock is showing a bullish falling wedge pattern, which often signals a potential breakout. Previously, a similar wedge resulted in a significant breakout, delivering a 77% return. Right now, the stock is trading around the 20-day and 50-day EMAs but is still below the 200-day EMA. Notably, the falling wedge trendline has been tested five times.
Momentum is turning positive. The RSI has just pulled back from overbought levels but is now moving upwards. The MACD is also rising and could soon form a golden cross, especially if we see higher buying volume in the next few days.
A key factor to watch in the coming days will be whether buying volume increases, as this would confirm the breakout from the falling wedge pattern and reinforce the continuation of the uptrend. The first resistance level to monitor is at RM0.23. If the stock manages to break above this level, it could push toward RM0.30. Conversely, if the price drops below RM0.145, it could signify the beginning of a correction phase.
Entry – RM0.165 – RM0.185
Stop Loss – RM0.145
Target Price – RM0.230 – RM0.300
Source: Mercury Securities Research - 22 Aug 2024
Related Stocks
| Chart | Stock Name | Last | Change | Volume |
|---|


