MN Holdings (0245) - Double Triangle Breakouts
MercurySec
Publish date: Fri, 01 Nov 2024, 09:18 AM
Technical Highlights
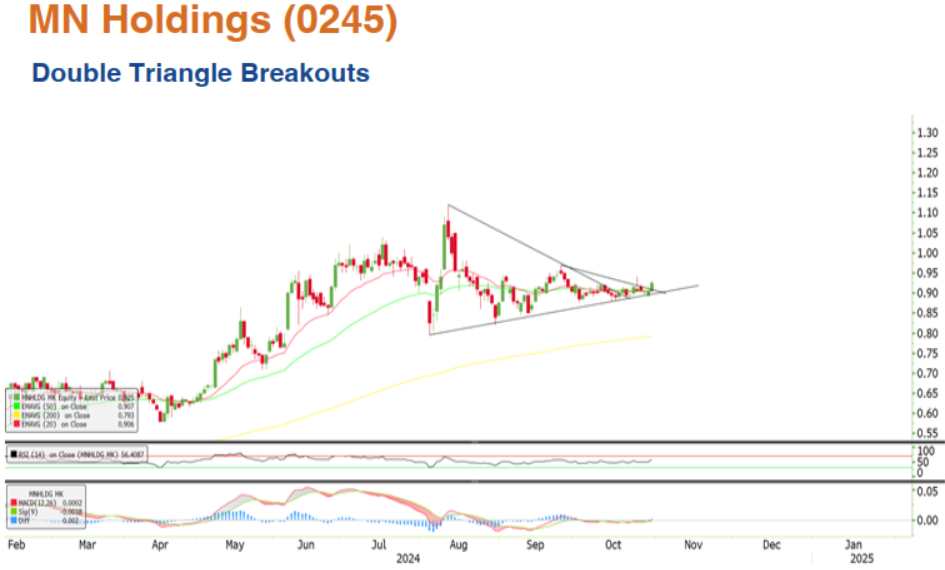
After reaching its 52-week high, the stock entered a sharp correction phase as trading momentum began to slow. Recently, however, the return of trading momentum seems to have triggered a recovery, with the stock now trading in a pattern of higher highs and higher lows. This upward movement also broke through the triangle pattern, indicating the stock is on track for further upside.
Momentum indicators are supportive of the stock’s bullish outlook. The RSI is moving sharply upward, signalling strong buying interest. Additionally, the recent formation of a golden cross in the MACD confirms that positive momentum is building, supporting further bullish movement.
For an ideal entry point, it lies within the RM0.905 to RM0.925 range. The first resistance level to watch is RM0.950; a breakout above this level could drive the stock toward the next resistance at RM1.04. On the flip side, if the stock descends below the recent support level at RM0.900, it could signal a return to consolidation.
Entry – RM0.905 – RM0.925
Stop Loss – RM0.850
Target Price – RM0.950 – RM1.04
Source: Mercury Securities Research - 1 Nov 2024
Related Stocks
| Chart | Stock Name | Last | Change | Volume |
|---|
Market Buzz
2025-01-11
MNHLDG2025-01-08
MNHLDG2025-01-08
MNHLDG2025-01-08
MNHLDG2025-01-08
MNHLDG2025-01-07
MNHLDG2025-01-07
MNHLDG2025-01-07
MNHLDG2025-01-07
MNHLDG2025-01-07
MNHLDG2025-01-07
MNHLDG2025-01-07
MNHLDG2025-01-07
MNHLDG2025-01-07
MNHLDG2025-01-07
MNHLDG2025-01-07
MNHLDG2025-01-07
MNHLDG2025-01-07
MNHLDG2025-01-07
MNHLDG2025-01-07
MNHLDG2025-01-03
MNHLDG2025-01-03
MNHLDG2025-01-03
MNHLDG2024-12-31
MNHLDG


