Ann Joo (6556) - Falling Wedge Breakout – Trend Shift?
MercurySec
Publish date: Tue, 05 Nov 2024, 09:55 AM
Technical Highlights
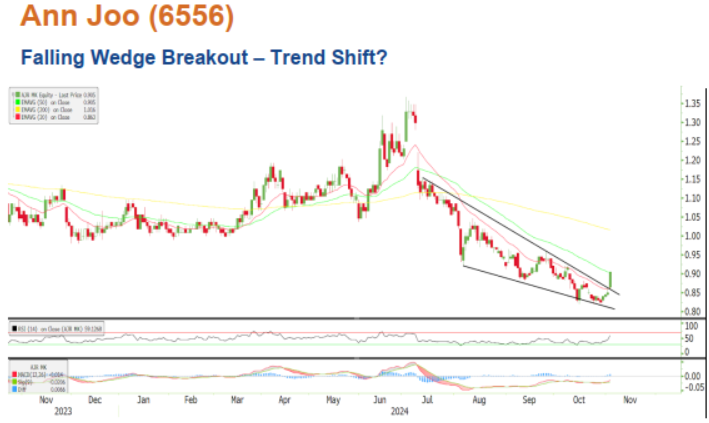
The stock has been in a downtrend since July 2024, forming a falling wedge pattern along the way. Yesterday, it broke out of this pattern, leaving the previous squeeze zone with a 6.5% gain, signalling a potential trend reversal. The stock is now trading above its 20-day EMA and challenging the 50-day EMA, with the 200-day EMA as the next hurdle to clear.
Momentum indicators are aligning well with this breakout. The RSI sits at 59, moving upward with strength, suggesting growing buyer interest. The MACD also formed a golden cross last month and continues to rise. This upward movement reflects an increase in buying activity, adding to the stock’s bullish outlook in the short term.
An ideal strategy here could be to wait for a pullback between RM0.88 and RM0.90 as a potential entry point. The first key resistance lies at RM0.96, and a successful break here could open a path toward RM1.05—a previous consolidation zone that may present a challenge. On the downside, a drop below RM0.83 could lead to further correction toward RM0.66.
Entry – RM0.88 – RM0.90
Stop Loss – RM0.83
Target Price – RM0.96 – RM1.05
Source: Mercury Securities Research - 5 Nov 2024
Related Stocks
| Chart | Stock Name | Last | Change | Volume |
|---|
More articles on Mercury Securities Research
Created by MercurySec | Jan 22, 2025


