


MQTrader Education Series
MQ Trader Strategy – EMA 5 Crossover

MQTrader Jesse
Publish date: Mon, 23 Jul 2018, 11:48 AM
EMA 5 Crossover
EMA (Exponential Moving Average) 5 Crossover is a strategy that shows the current trend of a stock when a short term moving average crosses a long term moving average (i.e. EMA 5 crosses EMA 20 when the trend changes). Hence, it provides you an indication to enter a position right at the beginning of a new trend.
There will be possibilities that we may get false crossovers which the chart does not turn out to be a start of a new trend. To increase the accuracy of the signal, one of the effective ways is using multiple time frames.
How to calculate EMA?
Example for calculating EMA 20
The formula to calculate EMA 20:
Multiplier: (2 / (Time periods + 1)) = (2 / (20 + 1)) = 0.0952
EMA: (Close – EMA (previous day)) x multiplier + EMA (previous day)
Strength of EMA 5 Crossover
- Fast response to price changes.
- Helpful for trades attempting to trade intraday, as EMA signals trend changes rapidly.
Weakness of EMA 5 Crossover
- More vulnerable to false signals under certain conditions such as low trading volume.
- Getting whipsawed back and forth.
How to trade by using EMA 5 Crossover?
MQ Trader stock analyzing system assists us to find the BUY and SELL signals easily by using Green and Red arrows respectively when the following conditions are met:
Entry Strategies:
- EMA 5 crosses the EMA 20 from the bottom.
- RSI goes above 50
Exit Strategies:
- EMA 5 crosses the EMA 20 from the top.
- RSI goes below 50.
EMA strategy on analyzing Supermax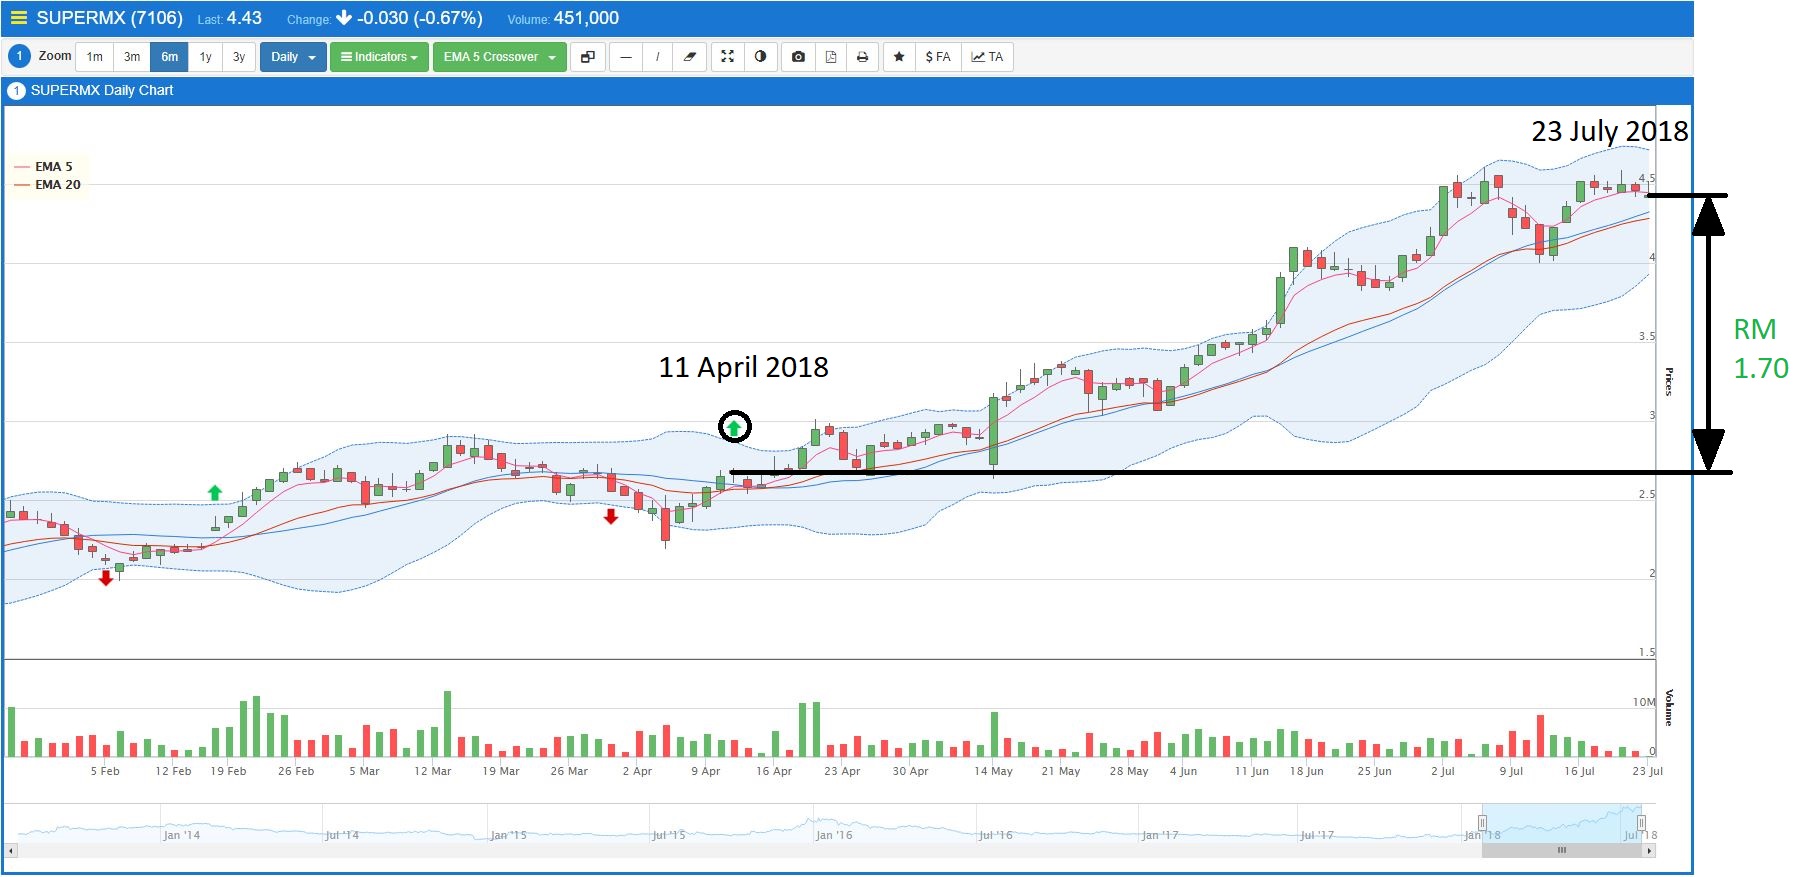
Figure 1: Daily chart of EMA 5 Crossover where each candle stick represents price movement within a day.
Daily chart is more suitable for swing traders, as the price movement of the chart will be more stable and more suitable for swing trader / mid-term trader that could manage that portfolio even at the end of the day.
Figure 1 demonstrates how the buy and sell signals appear when the entry and exit criteria is met respectively on a daily chart. There is a buy signal observed on 11th April 2018 when the bullish trend started to emerge. The sell signal has not appeared yet indicating that the bullish trend is still ongoing at the moment. Profits of around RM 1.70 per share (RM 4.40 – 2.70) can probably be earned if we follow the buy signal (11/04/2018) and sell the shares on 23th July 2018.
The shorter the time basis used to compute the chart, the more sensitive is the price movement. When we change the time basis of the chart from hourly to 30 minutes, the trading signals can be observed more frequently.
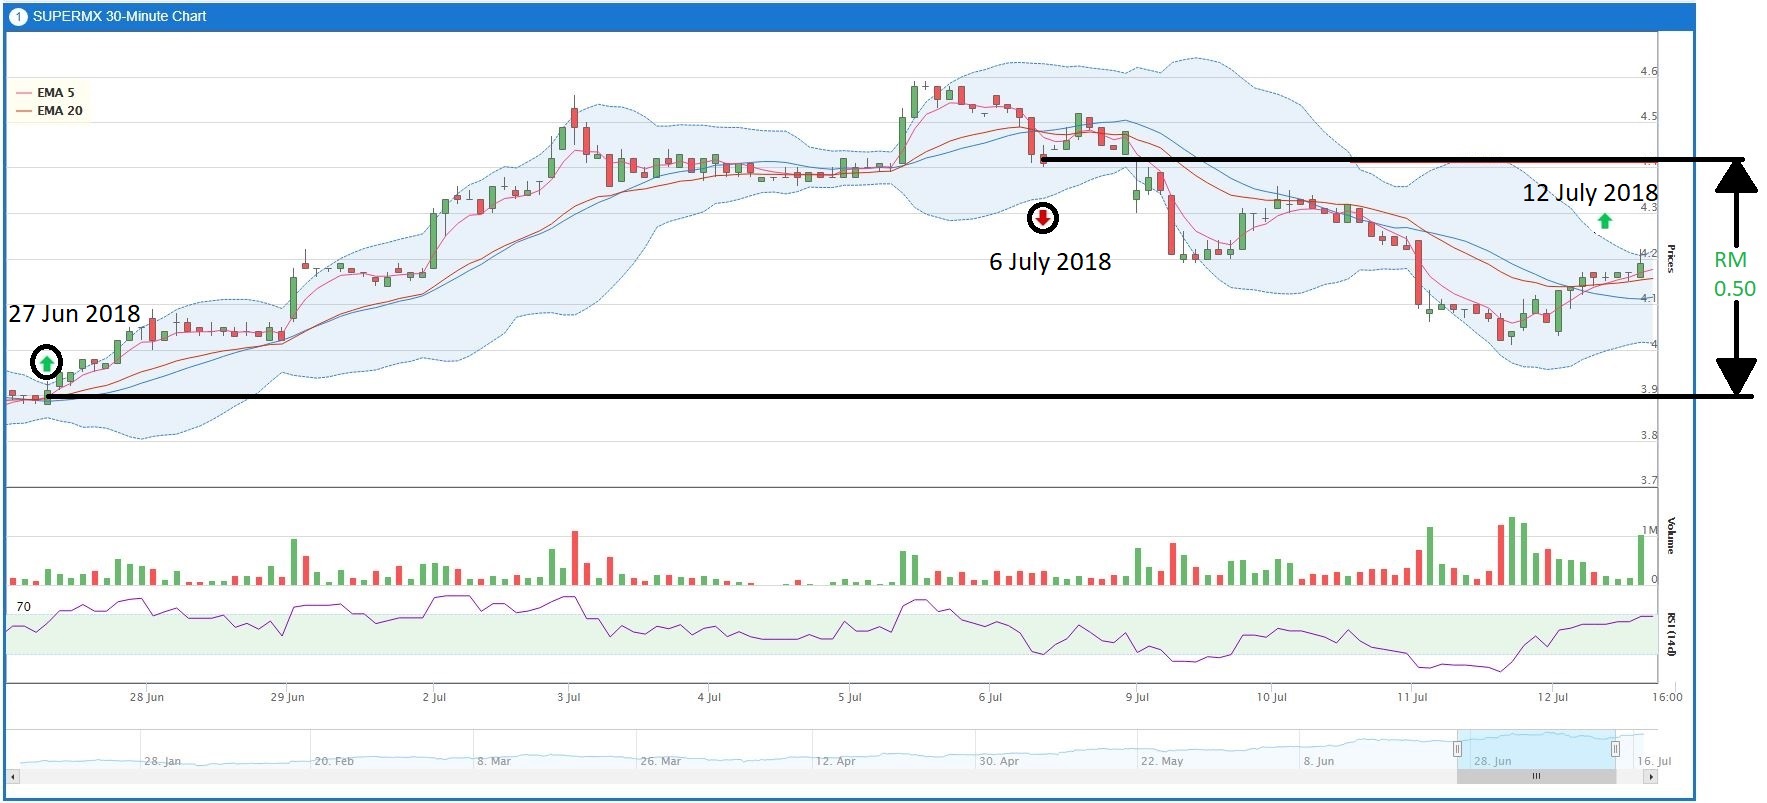
Figure 2: 30 Minutes chart for EMA 5 Crossover where each candle stick represents price movement within 30 minutes.
According to figure 2, RM0.50 (per share) of profit can be taken within a shorter time between 26/6/2018 to 7/7/2018 which is only around a week as compared to daily chart’s trading signal which takes around 2 months. Another buy signal followed by a significant increase of buying volume is found recently based on the entry criteria as mentioned earlier. Thus, 30 minutes chart is more suitable for traders who would like to use “fast in fast out” strategy.
5 minutes and 10 minutes charts are indicating an extremely rapid price movement which is more suitable for day traders. However, we can also refer to these charts for understanding the market sentiments on that particular day to anticipate the price movement before we decide to enter or exit from our positions.
Conclusion
EMA 5 Crossover can be a very powerful tool for our investment. However, weakness of EMA 5 Crossover should be taken into consideration to increase the accuracy of this strategy.
One of the effective methods is confirming the trading signals by using other trading strategies including MACD and RSI, ADX Crossover, OBV Breakout and Guppy MMA.
Community Feedback
We encourage traders to try out and evaluate the MQ Trader system and provide us feedback on the features you like to see in the system. We have received many positive feedbacks so far, and we are currently compiling and reviewing them for possible inclusion into the next release of the system.
We would like to develop this system based on community feedback to cater for community needs. Thanks to all those who have provided valuable feedback to us. Keep those feedbacks coming in!
Disclaimer
This article does not represent a BUY or SELL recommendation on the stock covered. Traders and Investors are encouraged to do their own analysis on stocks instead of blindly following any Trading calls raised by various parties in the Internet. We may or may not hold position in the stock covered, or initiate new position in the stock within the next 7 days.
Join us now!
MQ Trader stock analysis system uses Artificial Intelligence (AI), various technical indicators and quantitative data to generate accurate trading signals without the interference of human's emotions and bias against any particular stock. It comprises trading strategies which are very popular among fund managers for analysing stocks.
MQ Trader stock analysis system is SPONSORED for MQ Trader members. To use this amazing tool, you can sign up via MQ Trader Sign Up!
Contact us
Please do not hesitate to contact us if you have any enquiry:
Email: service@mqtrader.com
Related Stocks
| Chart | Stock Name | Last | Change | Volume |
|---|
More articles on MQTrader Education Series

Is there a safe haven to invest in a recessionary environment?
Created by MQTrader Jesse | Apr 13, 2023
MQ Trader - Why trade in a stock market that has strong currency?
Created by MQTrader Jesse | Aug 06, 2021
MQ Trader - How to validate buy signals by using MQ Live Backtesting? [ECOWLD]
Created by MQTrader Jesse | Nov 01, 2019
Featured Posts
Introducing MY's First IPO Fund for Sophisticated Investors!
New Update. Discover investment communities that resonate with your ideas
M & A Value Partners IPO Equity Fund has been launched - Targeted 13% Return p.a
Latest Videos


Apps


Top Articles
1
RHB Investment Research Reports
2
3
HLBank Research Highlights
4
Double Swords 双剑论股
5
MQ Market Updates
6
M+ Online Research Articles
7
Kenanga Research & Investment
YTL Power International - 1-for-5 Warrants to Reward Shareholders
8
RHB Investment Research Reports
#
Stock
Score
Daily Stocks
Stock Name
Last
Change
Volume
Stock Name
Last
Change
Volume
Stock Name
Last
Change
Volume
Featured Advertisers / Partners


Ride The Bull Short The Bear
CS Tan
4.9 / 5.0
This book is the result of the author's many years of experience and observation throughout his 26 years in the stockbroking industry. It was written for general public to learn to invest based on facts and not on fantasies or hearsay....