MQ Trader Share Discussion - HIBISCS (5199) - 3 Oct 2018
MQTrader Jesse
Publish date: Wed, 03 Oct 2018, 04:38 PM
HIBISCS (5199)
MQ Fundamental Rating

It is a fundamentally poor stock, as it fails most of the fundamental tests. Normally, we will not pick stocks with fundamental rating which is less than 2.5 for long term investment.
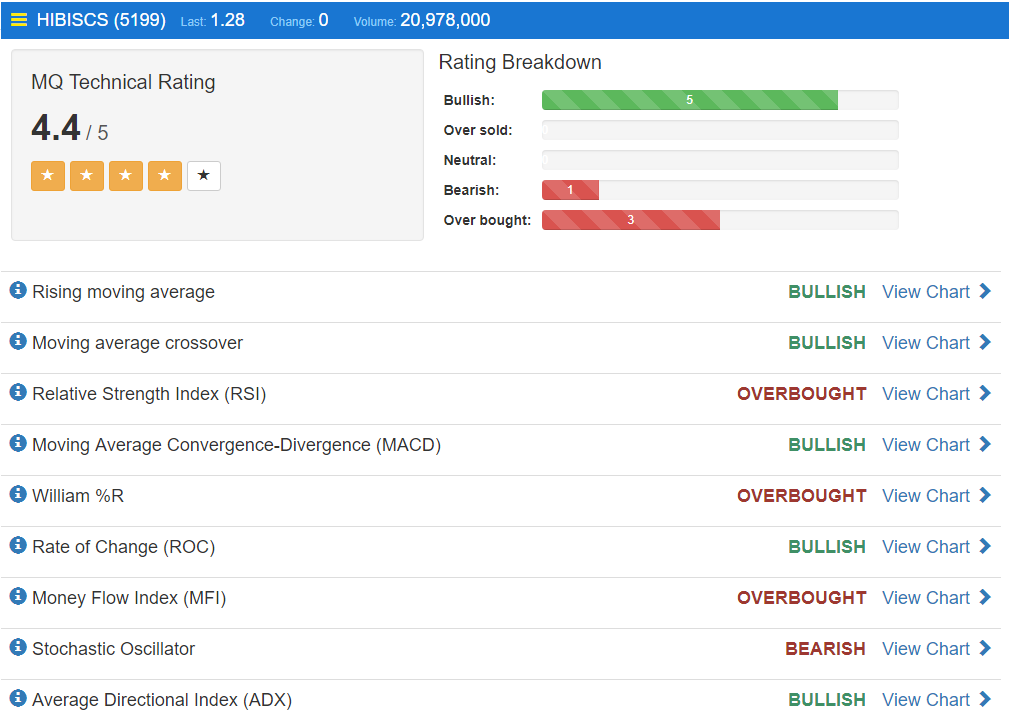
MQ Technical Rating

The uptrend price movement of HIBISCS is mainly caused by good financial result in the last 2 quarters. This is mainly contributed by the completion of the first infill drilling project at Anasuria and the recovery of production rate in North Sabah.
MQ Trading Strategy
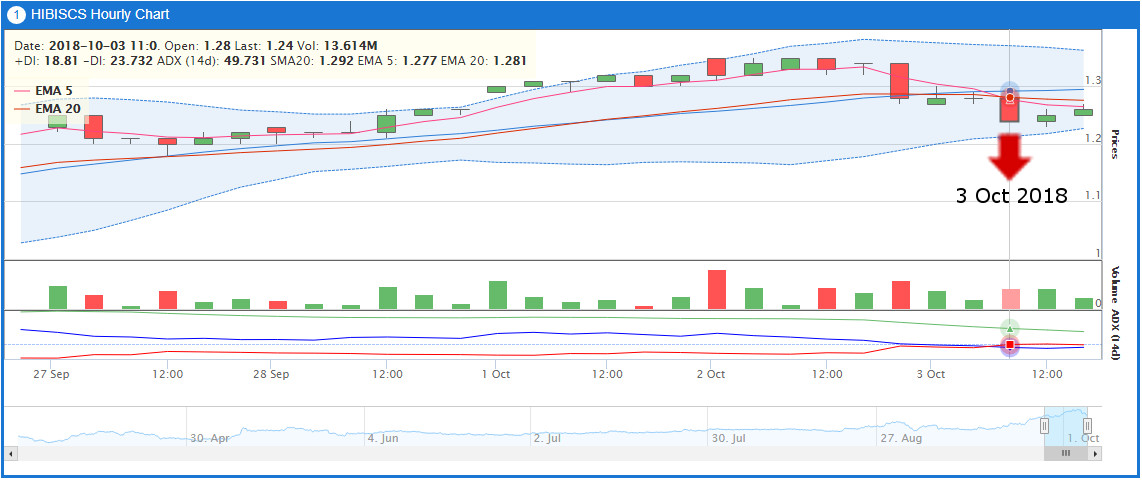
EMA 5 Crossover Hourly Chart

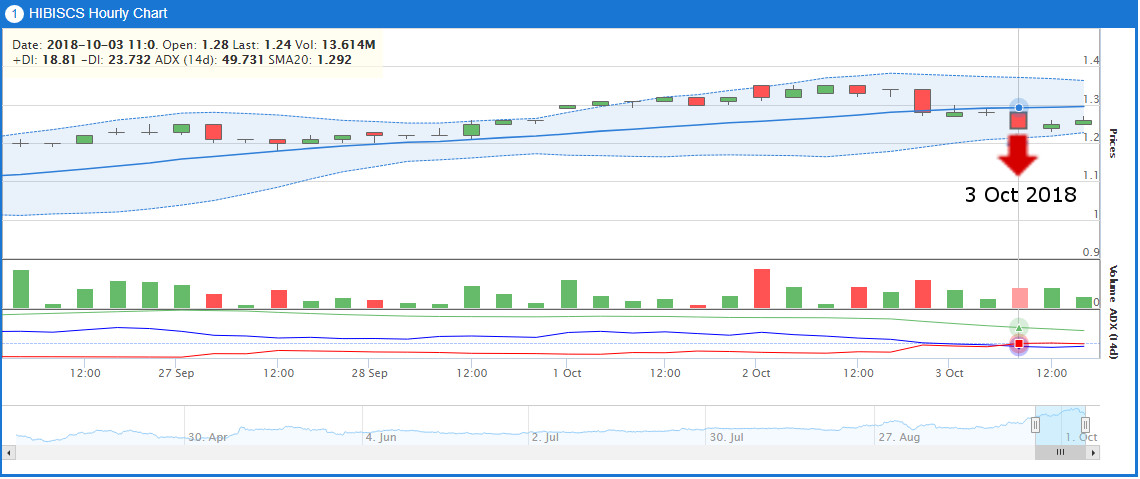
ADX Crossover Hourly Chart

Based on the EMA 5 Crossover and ADX Crossover Hourly Chart, sell signals are observed indicating that the sell momentum is greater than the buy momentum currently.
Conclusion
In our opinion, we will start to look for sell signals from the trading strategy (i.e. EMA 5 Crossover) at the moment. At the meantime, we can pay attention to the financial report of the next quarter and news from time to time to see if there is any positive catalyst to boost the share price.
MQ Trader Analysis Tool
To view HIBISCS’s technical analysis on MQ Trader: https://klse.i3investor.com/mqtrader/sf/analysis/stkta/5199
To view HIBISCS’s fundamental analysis on MQ Trader: https://klse.i3investor.com/mqtrader/sf/analysis/fa/5199
MQ Trader Workshop
For those who are interested to know more about MQ Trader Stock Analysis System, you can visit MQ Trader Workshop - Trade Signal Analysis & Backtesting With MQ Trader [Free Registration!] to get more information about our coming workshop on 6 October 2018.
Community Feedback
We encourage traders to try out and evaluate the MQ Trader system and provide us feedback on the features you like to see in the system. We have received many positive feedbacks so far, and we are currently compiling and reviewing them for possible inclusion into the next release of the system.
We would like to develop this system based on community feedback to cater for community needs. Thanks to all those who have provided valuable feedback to us. Keep those feedbacks coming in!
Disclaimer
This article does not represent a BUY or SELL recommendation on the stock covered. Traders and Investors are encouraged to do their own analysis on stocks instead of blindly following any Trading calls raised by various parties in the Internet. We may or may not hold position in the stock covered, or initiate new position in the stock within the next 7 days.
Join us now!
MQ Trader stock analysis system uses Artificial Intelligence (AI), various technical indicators and quantitative data to generate accurate trading signals without the interference of human's emotions and bias against any particular stock. It comprises trading strategies which are very popular among fund managers for analysing stocks.
MQ Trader stock analysis system is SPONSORED for MQ Trader members. To use this amazing tool, you can sign up via MQ Trader Sign Up!
Contact us
Please do not hesitate to contact us if you have any enquiry:
Related Stocks
| Chart | Stock Name | Last | Change | Volume |
|---|
More articles on MQTrader Stock Discussion
Created by MQTrader Jesse | May 20, 2021
Created by MQTrader Jesse | Jul 05, 2019
Created by MQTrader Jesse | Jun 03, 2019
Discussions
You may also want to see my first laggard O&G stock here:
https://klse.i3investor.com/blogs/dieforrich/176263.jsp
2018-10-03 23:44


diehardunited
Forget Hibiscus. I have here another lagged O&G stock you don’t want to miss!
https://klse.i3investor.com/blogs/dieforrich/176703.jsp
2018-10-03 23:39