[ MRCB ] - 还有涨停板的机会吗 ?? - J4 Investing Capital
J4InvestmentCapital
Publish date: Mon, 16 Jul 2018, 09:31 PM
[ MRCB ] - 还有涨停板的机会吗 ??? - J4 Investing Capital
众人所知 MRCB 是间建筑公司, 其中有负责一些高速公路, 产业, 高楼, 还有最吸引人的铁路.
手握超过 RM 70 亿合约的公司 , 加上有 LRT 3 和 HSR 合约 , 让早前的股价大幅度飙涨 , 吸引许多散户前来购买. 公司里股票持有人大多数是本地基金, 所以在这么多的政府工程 , 它都会占有一定的优势.
在去年四月, 股价从 2016 年的 RM 0.80 , 一直涨到最高点 RM 1.80 , 涨幅高达100 + %. 但在当初的最高点后事情却出现了变化, 市场开始担忧2018 年的大选成绩, 是否会影响公司的合约 , 开始抛售套利.
来到今年大选 509 , 前朝政府如预算中败选, 股价明显的往下冲, 让大家开始对这件公司产生质疑, 是否之前与前朝签署的合约能如期进行? 在 2018 年 5 月29 日, 希盟政府取消了 HSR 的合约, 认为国家还不需要这项工程 , 也没能力支付这款债务 . 过后 , 政府又表明将取消 LRT 3 的合作, 让大家失去了信心, 股价一度跌至 RM 0.55 .
现在政府又承诺会把 LRT 3 工程缩小, 降低成本, 将工程继续进行. 问题是政府和管理层能保证未来不会再有更改吗? 那就要让时间来证明了.
我们可以看看公司的
基本面 :
P/E : 14
EPS: 4.889
ROE : 3.62
DPS : 1.75
DY : 2.55
NTA : 1.103
E/Y : 5.68%
Debt to Equity : 0.51
EV/ EBIT : 17.59
Price to Book : 0.51
Dividend Policy : -

Intrinsic value analysis 真实价值:
According to cash valuation method , MRCB intrinsic value is currently priced at 0.91 , which is 33% higher than the current closing price (0.685 ) . MRCB shares price drops 75.5 sen(58%) from its year high of RM 1.305 . The reasons of the slump comprise of political issue ( party transition to PH) , the review of mega infrastructure project by the new government (PH) .
We see it as a golden opportunity to pick up this stock amid market fearful sentiment from the perspective of fundamental , investor overreact on this stock due to uncertainties in construction sector , it is traded under its fair value , there is a potential profit of 58% .
PEG ratio = PE/ Growthrate(est)
= 17/8
= 2.125 >1 ( overvalue)
From PEG ratio , MRCB is overvalued , however I view it as a blind spot in PEG ratio , the PE is high because EPF / Government Fund is holding a big portion of the shares , therefore investor are willing to give it a higher valuation , it hence sums up my stand that MRCB is still a value buy from the perspective of fundamental .
The recent shareholding changes are shown in the picture below :
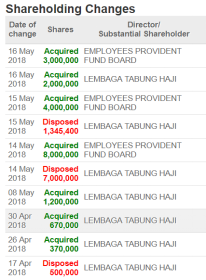
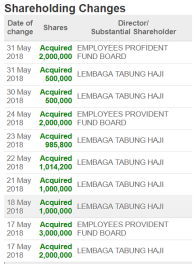
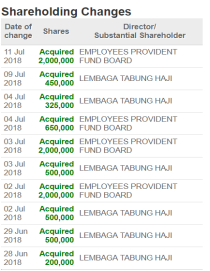
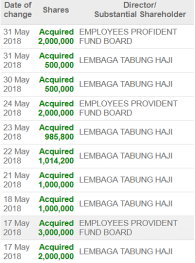
It shows that EPF and Lembaga Tabung Haji are accumulating on the heavy slump after GE14 , if we analyse it from the sense of logic , how a fund will rush into this stock if their profit will be affected by the party transition and review of mega project . Nevertheless , there are some investors telling us that this is an approach that EPF commonly uses to average down their aggregate buying price , I remain my stand that a professional fund manager know which stock to average down , they wont be rushing in a stock that are not fundamentally driven .
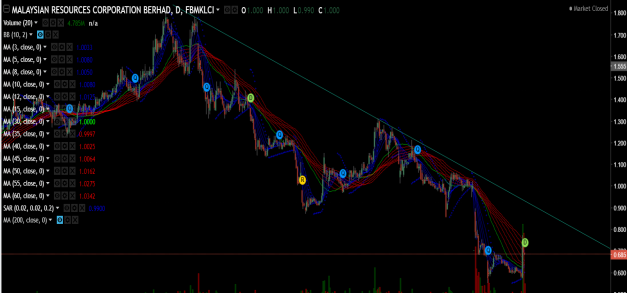
Chart Pattern Analysis :
The downtrend line are still not being violated , therefore still not a best point to buy . The circle region is where the big player / market maker accumulate desperately . It is seen to be a rock bottom that wont be violated , aggressive investor can choose to enter now , however a conservative style investor can choose to enter when the downtrend resistance line is violated under high volume .
The recent long green candlestick is a way of fund manager to balance their portfolio after aggressive buy on this counter , they are selling their shares after a price surge . Evidence such as the picture below :
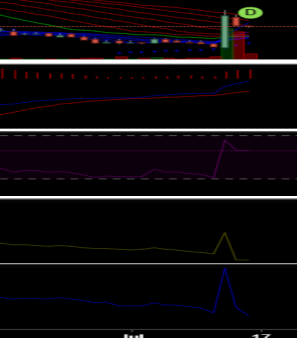
The yellow circle region indicates the smart money are selling after a surge .
From the weekly chart as below , the on balance volume are showing a divergence , whereas the accumulation distribution indicator are going with the direction of the share price movement , it shows that the fund / smart money are injecting their capital to this shares , while all the retailers are selling amid a heavy plunge .
Conclusion :
Short Term : moderate
Middle term and Long term : Bullish
Buying Price : 0.65
Current situation : A retracement is going to happen very soon into the GPMMA region .
Disclaimer : Information above is for sharing and education purposes , not a buy and sell advice , please refer to ur advisory for any buy or sell call , buy and sell at your own risk .
Happy investing !
More fundamental analysis are going to be published on construction sector and on this shares , MRCB , stay tune on our page , more surprise is coming out !
Feel free to visit our FB Page and share it out so that we share more things !!!
https://www.facebook.com/J4-Investment-Capital-398139627315097/
J4 Investment Capital.
Related Stocks
| Chart | Stock Name | Last | Change | Volume |
|---|


