


Gadang - Chart the next phase of growth.
Gadang - Chart the next phase of growth.

Gadang - Chart the next phase of growth.
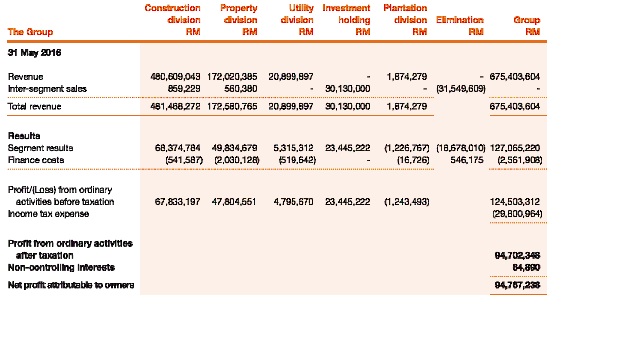
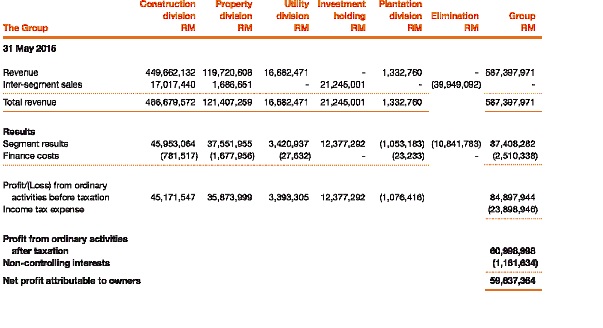
TABLE A:
| Financial Year - Net Profit Margin % | Construction | Property | Utility | Plantation |
| 2016 | 14% | 28% | 23% | -66% |
| 2015 | 10% | 29% | 20% | -81% |
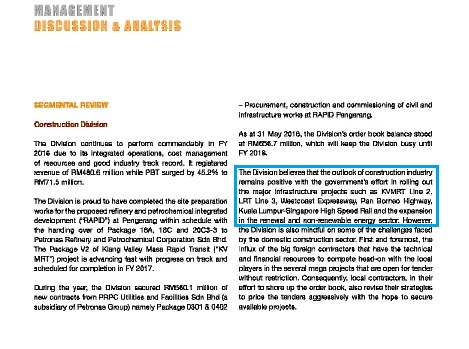
Construction Division:
Gadang continue to bid infrastructure jobs with preserve profit margin and maintain a healthy book orders.
Gadang seem maximise it workforce for better margin projects, rather than recording HIGH revenue but LOW profit.
We can see at Table A.
As at September, its tenderbook was at RM5.2 billion, mainly on highways and viaduct jobs for the MRT2.
RHB stated RM300-500 mllion annual orderbook replenishment rate assumption to be achievable and reasonably.
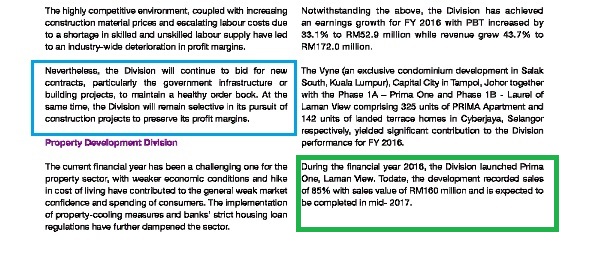
Property Division:
Gadang manage to shown continue improvement in sales value and new launching at PRIMA 2 at Cyberjaya and affortable housing at
Semenyih to sustain it revenue and profit margin.
As at 30 May 2016, unbilled sales of RM233 million, represented 1.35 times of FYE2016 revenue of property division.
Gadang was recently awarded the development rights for a 24.08-acre plot called R3-1 within the Kwasa Damansara township by the
master developer Kwasa Land, with GDV unknow yet, but in the region of RM700-900 million.
Utility Division:
Gadang have 4 water concessions with steady income from Indonesia.
Due to increase demand from rise population in Indonesia, Gadang expected major water and electricity plants are requited in near term.
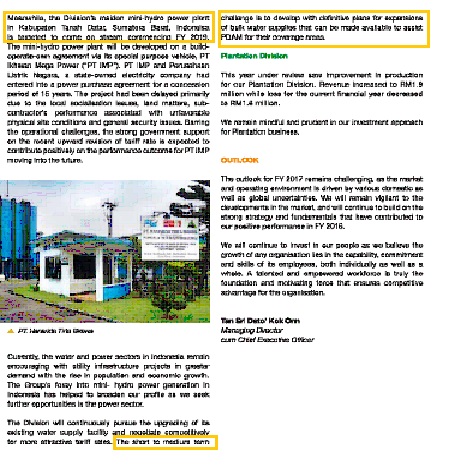
Gadang have established reputation in Indonesia and these will benefit them as eveidenced that Gadang able to develop and operate
mini-hyro power plant in Sumatera Barat, target to be commence in year 2018/2019.
Conclusion
Year by year, Gadang was continue improving their both revenue and profit margin.
With PE less than 10x, is Gadang worth to consider?
(PE range of 10x-14x for small and mid-cap construction companies).
Featured Posts
Introducing MY's First IPO Fund for Sophisticated Investors!
New Update. Discover investment communities that resonate with your ideas
M & A Value Partners IPO Equity Fund has been launched - Targeted 13% Return p.a
Latest Videos


Apps


Top Articles
2
3
Koon Yew Yin's Blog
4
5
BFM Podcast
6
7
BFM Podcast
8
Axcapital's investment blog
KAB - Executing its way to a record quarter. Could more Petronas contracts be coming?
#
Stock
Score
Daily Stocks
Stock Name
Last
Change
Volume
Stock Name
Last
Change
Volume
Stock Name
Last
Change
Volume
MQ Trading Signals
Stock
Time
Signal
Duration
Stock
Time
Signal
Duration
Featured Advertisers / Partners


Ride The Bull Short The Bear
CS Tan
4.9 / 5.0
This book is the result of the author's many years of experience and observation throughout his 26 years in the stockbroking industry. It was written for general public to learn to invest based on facts and not on fantasies or hearsay....
The One •
Thank you for sharing ya..
2016-10-21 14:39