


Rakuten Trade Research Reports
Technical View - OSK Holdings Berhad

rakutentrade
Publish date: Fri, 07 Feb 2025, 09:18 AM
rakutentrade
0 2,298
An official blog in I3investor to publish research reports provided by Rakuten Trade research team.
All materials published here are prepared by Rakuten Trade. For latest offers on Rakuten Trade products and news, please refer to: https://www.rakutentrade.my/
To sign up for an account: http://bit.ly/40BNqKI
Rakuten Trade
Hotline: +603 2110 7110 (Account Opening, General enquiry)
Email: customerservice@rakutentrade.my
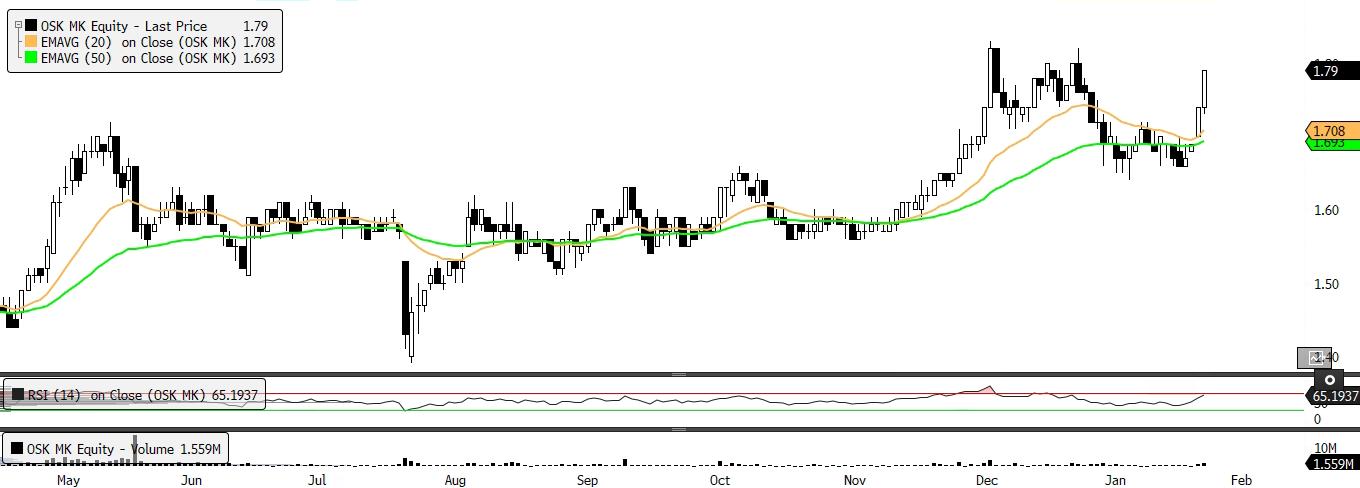
OSK Holdings Berhad (OSK, 5053)
- We believe OSK will continue with its uptrend to test higher levels after a bullish flag breakout, followed by an upside gap formed two sessions ago. This indicates that the stock has regained its bullish momentum and is poised to break out from its all-time high at RM1.84, supported by an uptick in EMA lines.
- Thus, we expect the upward trajectory to persist and test the initial resistance at RM1.83 (R1) followed by RM1.93 (R2).
- On the downside, stop-loss is set at RM1.65.
| Basic Data | Technical | Ratings | |||
| 52-week High | RM1.83 | Entry Level | RM1.75 - RM1.79 | RSI | Neutral |
| 52-week High | RM1.38 | Resistance 1 | RM1.83 | Trend | Bullish |
| Current Level | RM1.79 | Resistance 2 | RM1.93 | ||
| Support 1 | RM1.70 | ||||
| Support 2 | RM1.65 | ||||
Source: Rakuten Research -
To sign up for an account : http://bit.ly/40BNqKI
[Youtube Tutorial] Account Opening & Enable Foreign Equity: http://bit.ly/3I5Jzxo
Related Stocks
| Chart | Stock Name | Last | Change | Volume |
|---|
More articles on Rakuten Trade Research Reports
Discussions
Be the first to like this. Showing 0 of 0 comments
Post a Comment
Featured Posts


Latest Videos


MQ Trading Signals
Time
Signal
Duration
Type
2025-02-07 16:40:00
EMA 5
5 Mins
BUY
2025-02-07 16:35:00
EMA 5
5 Mins
SELL
2025-02-07 16:30:00
EMA 5
5 Mins
BUY
2025-02-07 15:10:00
ADX
5 Mins
SELL
2025-02-07 14:35:00
EMA 5
5 Mins
SELL
Apps


Top Articles
1
Stock Market Enthusiast
YTLPower: Hammer + Oversold + Strong Support Level Means Bullish Reversal?
2
CEO Morning Brief
These Big-cap Stocks on Bursa Pay More Than 5% Dividend Yield
3
Mercury Securities Research
4
5
Mercury Securities Research
6
RHB Investment Research Reports
7
TA Sector Research
8
Mercury Securities Research
#
Stock
Score
Daily Stocks
Stock Name
Last
Change
Volume
Stock Name
Last
Change
Volume
Stock Name
Last
Change
Volume
Featured Advertisers / Partners


Ride The Bull Short The Bear
CS Tan
4.9 / 5.0
This book is the result of the author's many years of experience and observation throughout his 26 years in the stockbroking industry. It was written for general public to learn to invest based on facts and not on fantasies or hearsay....