RHB Investment Research Reports
Trading Stocks - Samaiden Group
rhbinvest
Publish date: Mon, 30 Dec 2024, 09:52 AM

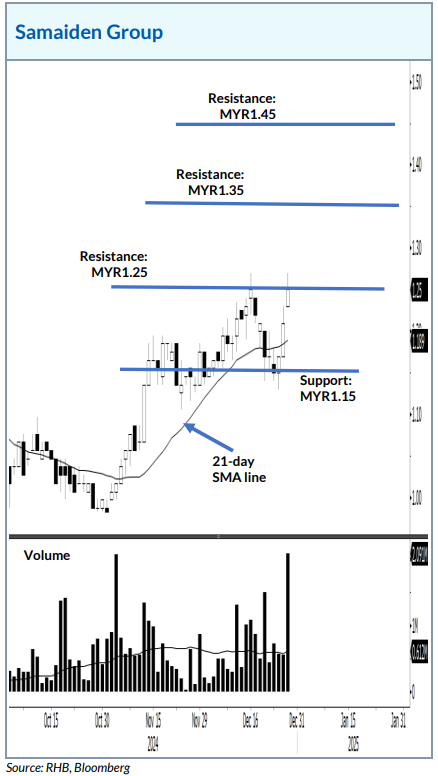
Samaiden Group is eyeing to extend the upside movement, testing the immediate resistance on high volume. The counter printed a fresh white candlestick last Friday – attempting to close above the MYR1.25 resistance. If a bullish breakout happens, this will attract fresh buying pressure. In this case, the bullish momentum may lift it towards MYR1.35, followed by the MYR1.45 level. In the event the stock falls below the MYR1.15 support, this will kickstart the correction phase.
Source: RHB Securities Research - 30 Dec 2024
Related Stocks
| Chart | Stock Name | Last | Change | Volume |
|---|
Market Buzz
2025-01-02
SAMAIDEN2024-12-31
SAMAIDEN2024-12-31
SAMAIDEN2024-12-31
SAMAIDEN2024-12-31
SAMAIDEN2024-12-31
SAMAIDEN2024-12-31
SAMAIDEN2024-12-31
SAMAIDEN2024-12-31
SAMAIDEN2024-12-31
SAMAIDEN2024-12-31
SAMAIDEN2024-12-31
SAMAIDEN2024-12-31
SAMAIDEN2024-12-30
SAMAIDEN2024-12-30
SAMAIDEN2024-12-30
SAMAIDEN2024-12-27
SAMAIDEN2024-12-27
SAMAIDEN2024-12-27
SAMAIDENMore articles on RHB Investment Research Reports
Discussions
Be the first to like this. Showing 0 of 0 comments


