


RHB Retail Research
FBM Small Cap Index - Positive Expectation Stays Intact

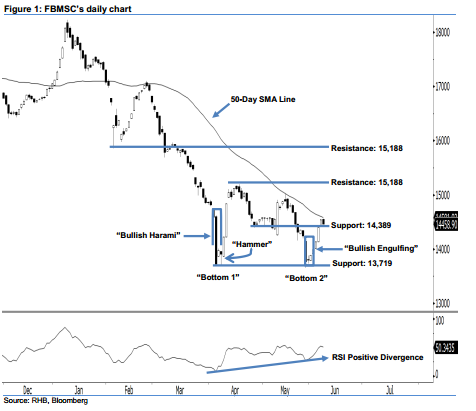
The positive outlook continues, as the 2-month bullish bias stays in play. After six increases in a row, the FBMSC finally slipped 83.24 pts to 14,458.90 pts last Friday. It left a black candle after having oscillated between a low of 14,451.49 pts and high of 14,556.55 pts. However, this does not change our upside view, as no strong downside development has been sighted yet. In fact, we view this as a normal reaction, especially after the index successfully breached above the previous 14,389-pt resistance on 7 Jun. Overall, the 2-month bullish bias remains firmly in play.
We initially thought the FBSMC found bottom at around 13,719 pts – first witnessed after the appearance of two reversal signals, ie 5 Apr’s “Bullish Harami” and 6 Apr’s “Hammer”. However, the “Double Bottom” and “Positive Divergence” reversal patterns have since appeared this month, and all these bullish signals were detected at the index’s 2-years lows – this enhances our view that the Jan-Mar 2018 correction was at its limit. From our technical viewpoint, the trend is shifting towards the upside from downside previously.
To the downside, we set the immediate support at 14,389 pts, or the low of 26 Apr’s “Bullish Harami” pattern. Our next support is seen at 13,719 pts, which was the low of 5 Apr’s “Bullish Harami” pattern. We keep the immediate resistance at 15,188 pts, ie 17 Apr’s high. The following resistance is found at the 15,857-pt mark, which is located at the low of 6 Feb’s “Hammer” pattern.
Source: RHB Securities Research - 11 Jun 2018
More articles on RHB Retail Research
Duopharma Biotech - Lacking Near-Term Re-Rating Catalysts; D/G NEUTRAL
Created by rhboskres | Aug 26, 2024
Discussions
Be the first to like this. Showing 0 of 0 comments
Post a Comment
Featured Posts


Latest Videos


Apps


Top Articles
1
THE INVESTMENT APPROACH OF CALVIN TAN
2
Koon Yew Yin's Blog
3
save malaysia!
5
6
7
8
Mercury Securities Research
#
Stock
Score
Daily Stocks
Stock Name
Last
Change
Volume
Stock Name
Last
Change
Volume
Stock Name
Last
Change
Volume
MQ Trading Signals
Stock
Time
Signal
Duration
Stock
Time
Signal
Duration
Featured Advertisers / Partners


Ride The Bull Short The Bear
CS Tan
4.9 / 5.0
This book is the result of the author's many years of experience and observation throughout his 26 years in the stockbroking industry. It was written for general public to learn to invest based on facts and not on fantasies or hearsay....