


RHB Retail Research
Technical Analysis - Kelington Group

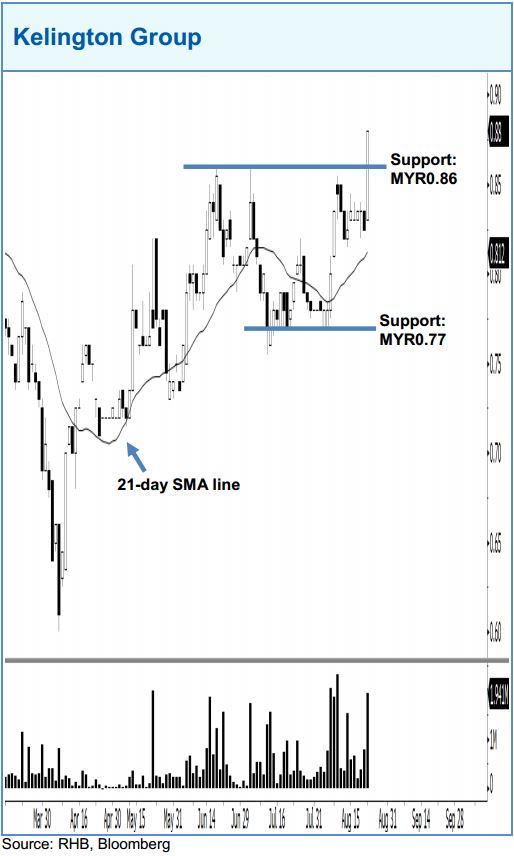
Kelington Group formed a long white candle, indicating that the momentum of buying could be strong. In view that the 21- day SMA line will likely begin turning upwards, this is an indication of a positive sign. A bullish bias may appear above the MYR0.86 level, with an exit set below the MYR0.77 threshold. Towards the upside, the near-term resistance is at MYR0.95. This is followed by the MYR1.00 level.
Source: RHB Securities Research - 24 Aug 2018
Related Stocks
| Chart | Stock Name | Last | Change | Volume |
|---|
More articles on RHB Retail Research
Duopharma Biotech - Lacking Near-Term Re-Rating Catalysts; D/G NEUTRAL
Created by rhboskres | Aug 26, 2024
Discussions
Be the first to like this. Showing 0 of 0 comments
Post a Comment
Featured Posts


Latest Videos


MQ Trading Signals
Time
Signal
Duration
Type
2024-11-26 16:40:00
ADX
10 Mins
SELL
2024-11-26 16:00:00
OBV
Hourly
BUY
2024-11-26 15:00:00
EMA 5
Hourly
SELL
2024-11-26 14:35:00
EMA 5
5 Mins
SELL
2024-11-26 14:30:00
EMA 5
10 Mins
SELL
Apps


Top Articles
1
2
THE INVESTMENT APPROACH OF CALVIN TAN
3
4
save malaysia!
5
Koon Yew Yin's Blog
7
8
CEO Morning Brief
#
Stock
Score
Daily Stocks
Stock Name
Last
Change
Volume
Stock Name
Last
Change
Volume
Stock Name
Last
Change
Volume
Featured Advertisers / Partners


Ride The Bull Short The Bear
CS Tan
4.9 / 5.0
This book is the result of the author's many years of experience and observation throughout his 26 years in the stockbroking industry. It was written for general public to learn to invest based on facts and not on fantasies or hearsay....