RHB Retail Research
Technical Analysis - Ideal Jacobs (Malaysia) Corp
rhboskres
Publish date: Mon, 26 Nov 2018, 10:18 AM

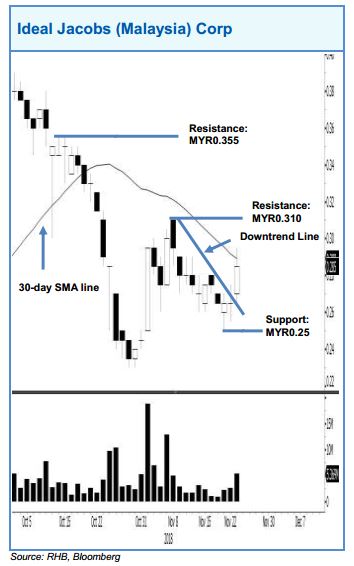
Ideal Jacobs formed a white candle in the latest session and, at the closing, breached above the downtrend line – as drawn in the chart. This indicates that the stock is likely to resume its upward move. Towards the upside, immediate resistance is at MYR0.31, followed by MYR0.355. For risk management purposes, a stop-loss can be placed at below MYR0.25.
Source: RHB Securities Research - 26 Nov 2018
Related Stocks
| Chart | Stock Name | Last | Change | Volume |
|---|
More articles on RHB Retail Research
Duopharma Biotech - Lacking Near-Term Re-Rating Catalysts; D/G NEUTRAL
Created by rhboskres | Aug 26, 2024
Discussions
Be the first to like this. Showing 0 of 0 comments


