


RHB Retail Research
FKLI - Above the 21-day SMA Line

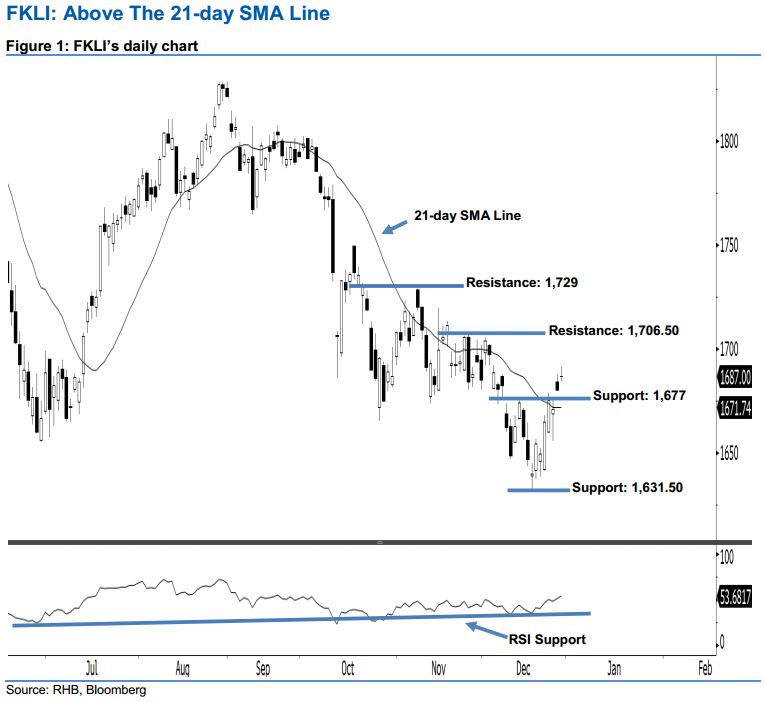
Stay long while setting a stop-loss below the 1,631.50-pt support. The FKLI formed a “Doji” candle last Friday. It closed at 1,687 pts, after oscillating between a high of 1,691 pts and low of 1,684 pts. From a technical perspective, we think the positive sentiment stays intact, as the index continued to remain above the 21-day SMA line. Given that the 14-day RSI indicator rose above the 50 neutral pt to flash a bullish reading at 53.68 pts, this would imply that the rebound is not diminished yet. As such, we think the buyers are still in control of the market.
As seen in the chart, we are eyeing the immediate support level at 1,677 pts, ie the high of 26 Dec. The next support is maintained at 1,631.50 pts, ie the previous low of 18 Dec. Towards the upside, we anticipate the immediate resistance level at 1,706.50 pts, which was the high of 27 Nov’s long black candle. Meanwhile, the next resistance is seen at 1,729 pts, defined from the previous high of 8 Nov.
Hence, we advise traders to maintain long positions, following our recommendation of initiating long above the 1,677-pt level on 28 Dec. In the meantime, a stop-loss can be set below the 1,631.50-pt threshold in order to limit the downside risk.
Source: RHB Securities Research - 31 Dec 2018
More articles on RHB Retail Research
Duopharma Biotech - Lacking Near-Term Re-Rating Catalysts; D/G NEUTRAL
Created by rhboskres | Aug 26, 2024
Discussions
Be the first to like this. Showing 0 of 0 comments
Post a Comment
Featured Posts


Latest Videos


Apps


Top Articles
2
save malaysia!
3
4
5
6
Koon Yew Yin's Blog
7
THE INVESTMENT APPROACH OF CALVIN TAN
8
Good Articles to Share
Le Pen makes new threat to withdraw support for French government
#
Stock
Score
Daily Stocks
Stock Name
Last
Change
Volume
Stock Name
Last
Change
Volume
Stock Name
Last
Change
Volume
MQ Trading Signals
Stock
Time
Signal
Duration
Stock
Time
Signal
Duration
Featured Advertisers / Partners


Ride The Bull Short The Bear
CS Tan
4.9 / 5.0
This book is the result of the author's many years of experience and observation throughout his 26 years in the stockbroking industry. It was written for general public to learn to invest based on facts and not on fantasies or hearsay....