FKLI - No Reversal Yet
rhboskres
Publish date: Fri, 04 Oct 2019, 09:25 AM

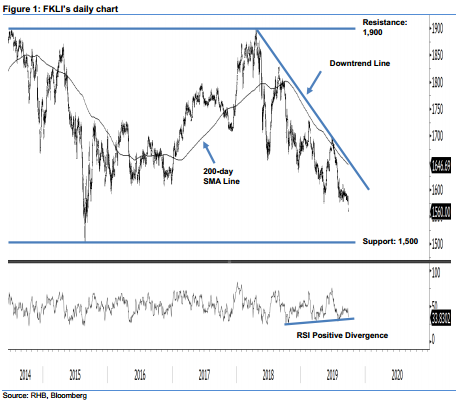
Maintain short positions. Today, we look at the FKLI’s long-term price movement. The index has been trading in a possible sideways pattern since Jun 2014, between 1,500 pts and 1,900 pts. The current multi-quarter weak trend started after the index failed to cross the 1,900-pt mark in Apr 2018. Since then, trading has remained under the downtrend line (as drawn on the chart) and the 200-day SMA line – with multiple failed attempts to cross above throughout the period. The latest session’s weak performance – where the previous immediate support of 1,573 pts was breached – continues to suggest the weak trend has not reached its low yet. Despite the RSI is flashing out a positive divergence, in the absence of a price reversal signal, we keep to our negative trading bias.
As the bears are still not showing signs of exhaustion (thereby staging a possible rebound), traders are advised to remain in short positions. We initiated these at 1,668 pts, or the closing level of 12 Jul. To manage risks, a stop-loss can now be placed above the 1,589-pt level, the high of the previous session.
We revised the immediate support to the 1,550-pt mark. This is followed by 1,500-pts. Moving up, the immediate resistance is now set at the 1,600-pt level, followed by 1,621.5 pts, the high of 9 Aug.
Source: RHB Securities Research - 4 Oct 2019
More articles on RHB Retail Research
Created by rhboskres | Aug 26, 2024


