


RHB Retail Research
Hang Seng Index Futures - Hovering Below the Downtrend Line

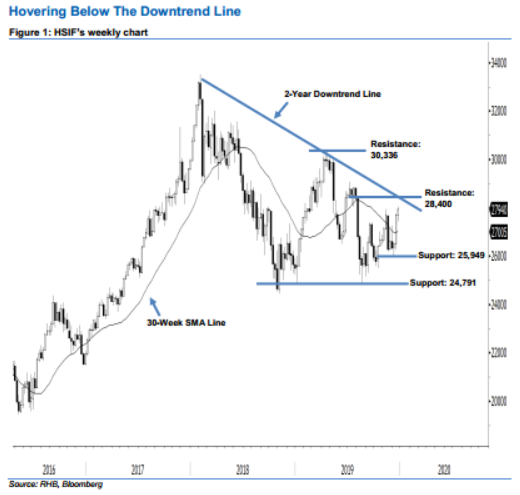
Market is trading below the 2-year downtrend line. Today, we analyse the HSIF’s longer-term trend. Based on the weekly chart, we believe the market trend is considered negative. This is because the index is still holding below the 2-year downtrend line drawn in the weekly chart. This line consists of the highs of 2 Feb 2018, 12 Apr, and 10 May. We view last week’s white candle as a technical rebound only. That said, this negative sentiment is likely to remain unchanged, as long as prices are trading below the aforementioned downtrend line.
According to the weekly chart, we are eyeing the immediate resistance level at 28,400 pts, situated near the 2-year downtrend line above. If a decisive breakout arises, look to 30,336 pts – ie the previous high of 15 Apr – as the next resistance. Towards the downside, the immediate support level is seen at 25,949 pts, which was the low of 4 Dec. Meanwhile, the next support is anticipated at 24,791 pts, obtained from the low of 15 Aug.
However, based on our analysis of the daily chart, we advise traders to maintain long positions. This is because the market is holding above the 27,380-pt support mentioned in our daily chart. Please refer to our 26 Dec report for more details.
Source: RHB Securities Research - 27 Dec 2019
More articles on RHB Retail Research
Duopharma Biotech - Lacking Near-Term Re-Rating Catalysts; D/G NEUTRAL
Created by rhboskres | Aug 26, 2024
Discussions
Be the first to like this. Showing 0 of 0 comments
Post a Comment
Featured Posts
Introducing MY's First IPO Fund for Sophisticated Investors!
New Update. Discover investment communities that resonate with your ideas
M & A Value Partners IPO Equity Fund has been launched - Targeted 13% Return p.a
Latest Videos


Apps


Top Articles
1
2
3
save malaysia!
Visa-free travel to China extended for Malaysians to 30 days
4
Good Articles to Share
5
Good Articles to Share
Four convicted in Spain over homophobic murder that sparked nationwode protests
6
Good Articles to Share
7
Good Articles to Share
What’s behind the slew of restaurant bankruptcies in 2024? Experts unpack the problems
8
Good Articles to Share
#
Stock
Score
Daily Stocks
Stock Name
Last
Change
Volume
Stock Name
Last
Change
Volume
Stock Name
Last
Change
Volume
MQ Trading Signals
Stock
Time
Signal
Duration
Stock
Time
Signal
Duration
Featured Advertisers / Partners


Ride The Bull Short The Bear
CS Tan
4.9 / 5.0
This book is the result of the author's many years of experience and observation throughout his 26 years in the stockbroking industry. It was written for general public to learn to invest based on facts and not on fantasies or hearsay....