E-mini Dow Futures - Taking a Breather
rhboskres
Publish date: Mon, 13 Jan 2020, 10:13 AM

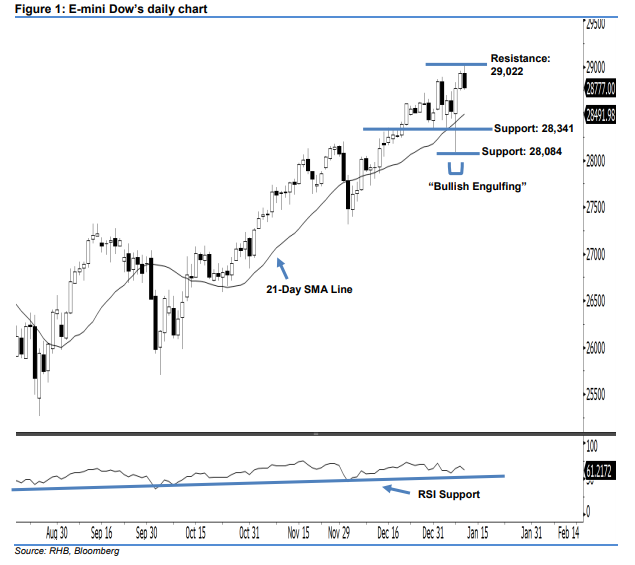
Stay long. The E-mini Dow ended lower to form a black candle last Friday. It declined 152 pts to close at 28,777 pts after oscillating between a high of 29,022 pts and low of 28,751 pts. However, it is not surprising that the market is experiencing profit-taking activities after the recent gains. On a technical basis, the bullish sentiment stays intact, given that the index is still trading above the rising 21-day SMA line. Currently, we think the market rebound from 8 Jan’s “Bullish Engulfing” pattern is not over yet.
As seen in the chart, we anticipate the immediate support level at 28,341 pts, ie near the lows of 31 Dec 2019 and 6 Jan. If a breakdown arises, look to 28,084 pts – the low of 8 Jan’s “Bullish Engulfing” pattern – as the next support. Towards the upside, the immediate resistance level is now seen at the 29,022-pt record high. The next resistance will likely be at the 29,500-pt round figure.
Consequently, we advise traders to maintain long positions – this follows our recommendation of initiating long above the 28,159-pt level on 17 Dec 2019. For now, a new trailing-stop can be set below the 28,084-pt mark to minimise the downside risk.
Source: RHB Securities Research - 13 Jan 2020
More articles on RHB Retail Research
Created by rhboskres | Aug 26, 2024


