E-mini Dow Futures : Long-Term Prospects Are Bullish
rhboskres
Publish date: Tue, 21 Jan 2020, 03:53 PM

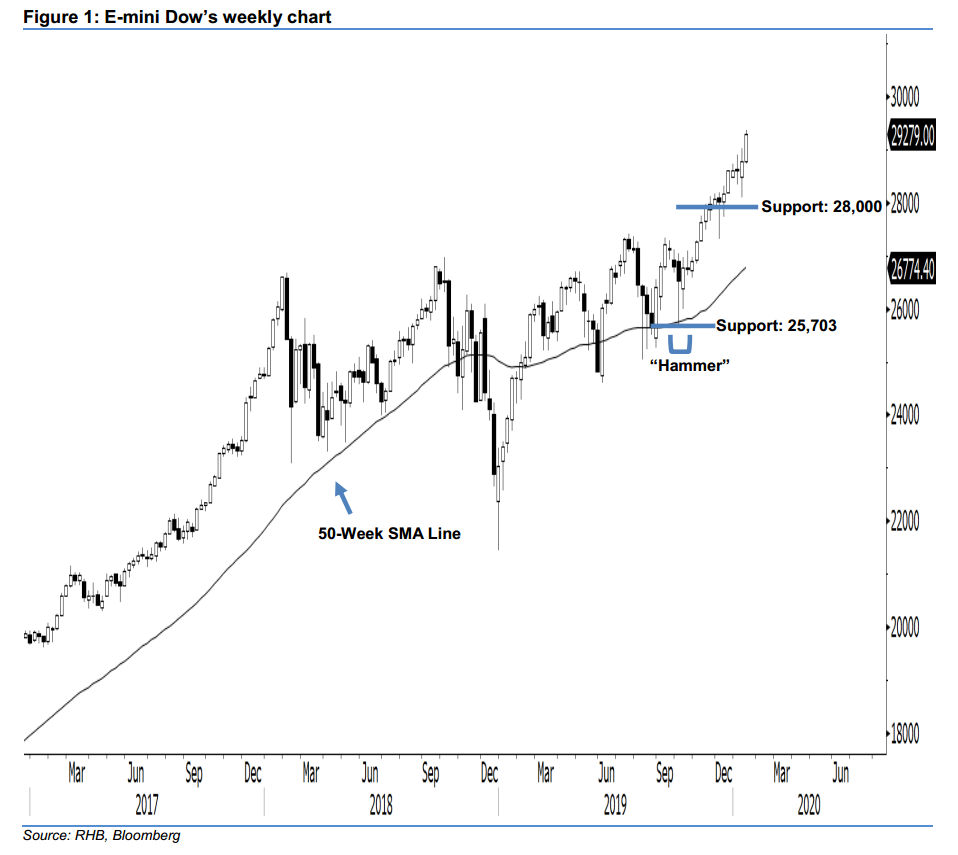
Bullish trend remains intact; stick to long positions. Today, we analyse the E-mini Dow’s longer-term trend. Based on the weekly chart, the index formed another white candle last week, which indicates the presence of buying momentum. The upside strength has continued as expected, as the index has recently climbed above the 28,000- pt threshold. In addition, the E-mini Dow remains above the rising 50-week SMA line, which means that the bullish sentiment has been enhanced. Overall, we expect the market to rise further.
As seen in the weekly chart, we anticipate the immediate support level at the 28,000-pt psychological mark. The next support is seen at 25,703 pts, which was the low of 3 Oct 2019’s “Hammer” pattern. Towards the upside, the immediate resistance level is situated at the 30,000-pt psychological mark. If a decisive breakout occurs, the next resistance is seen at the 31,000-pt round figure.
Overall, we advise traders to stick to long positions. This is because signs of a significant reversal have not emerged yet. Please refer to our previous report on 20 Jan 2020 for more details.
Source: RHB Securities Research - 21 Jan 2020
More articles on RHB Retail Research
Created by rhboskres | Aug 26, 2024


