RHB Retail Research
Trading Stocks - VisDynamics
rhboskres
Publish date: Thu, 20 Feb 2020, 04:43 PM

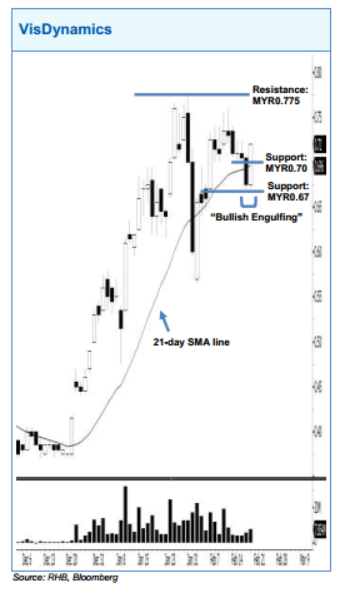
VisDynamics’ buying momentum may have returned after it rose above the 21-day SMA line. Yesterday’s white candle has engulfed the prior one to form a “Bullish Engulfing” pattern, implying a potential rebound. A positive bias may emerge above the MYR0.70 level, with an exit set below the MYR0.67 threshold. Towards the upside, the immediate resistance is at the MYR0.775 mark, followed by the MYR0.80 level.
Source: RHB Securities Research - 20 Feb 2020
Related Stocks
| Chart | Stock Name | Last | Change | Volume |
|---|
More articles on RHB Retail Research
Duopharma Biotech - Lacking Near-Term Re-Rating Catalysts; D/G NEUTRAL
Created by rhboskres | Aug 26, 2024
Discussions
Be the first to like this. Showing 0 of 0 comments


