


RHB Retail Research
Trading Stocks- CIMB Group

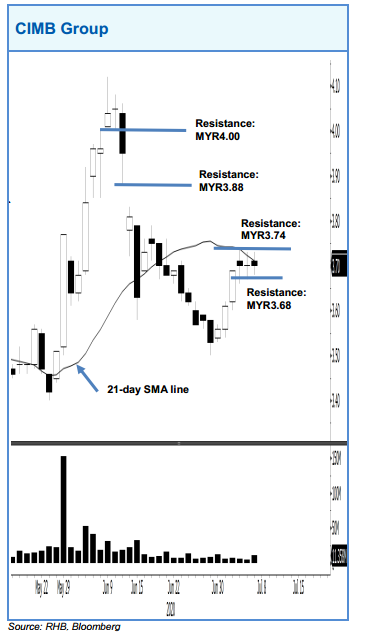
CIMB Group has been showing signs of developing a potential minor sideways consolidation over the past three sessions around the 21-day SMA line. An upside breach of the MYR3.74 mark could signal a positive bias, with resistance levels eyed at MYR3.88 followed by MYR4.00. A stop-loss can be placed below MYR3.68.
Source: RHB Securities Research - 13 Jul 2020
Related Stocks
| Chart | Stock Name | Last | Change | Volume |
|---|
Market Buzz
2024-11-24
CIMB2024-11-22
CIMB2024-11-22
CIMB2024-11-21
CIMB2024-11-21
CIMB2024-11-21
CIMB2024-11-20
CIMB2024-11-20
CIMB2024-11-20
CIMB2024-11-19
CIMB2024-11-19
CIMB2024-11-19
CIMB2024-11-19
CIMB2024-11-19
CIMB2024-11-19
CIMB2024-11-18
CIMB2024-11-18
CIMB2024-11-18
CIMB2024-11-15
CIMB2024-11-15
CIMB2024-11-15
CIMB2024-11-15
CIMB2024-11-15
CIMB2024-11-13
CIMB2024-11-13
CIMB2024-11-13
CIMB2024-11-13
CIMB2024-11-13
CIMB2024-11-12
CIMB2024-11-12
CIMBMore articles on RHB Retail Research
Duopharma Biotech - Lacking Near-Term Re-Rating Catalysts; D/G NEUTRAL
Created by rhboskres | Aug 26, 2024
Discussions
Be the first to like this. Showing 0 of 0 comments
Post a Comment
Featured Posts
Introducing MY's First IPO Fund for Sophisticated Investors!
New Update. Discover investment communities that resonate with your ideas
M & A Value Partners IPO Equity Fund has been launched - Targeted 13% Return p.a
Latest Videos


Apps


Top Articles
1
2
4
save malaysia!
Visa-free travel to China extended for Malaysians to 30 days
5
6
7
BFM Podcast
8
#
Stock
Score
Daily Stocks
Stock Name
Last
Change
Volume
Stock Name
Last
Change
Volume
Stock Name
Last
Change
Volume
Featured Advertisers / Partners


Ride The Bull Short The Bear
CS Tan
4.9 / 5.0
This book is the result of the author's many years of experience and observation throughout his 26 years in the stockbroking industry. It was written for general public to learn to invest based on facts and not on fantasies or hearsay....