


RHB Retail Research
Trading Stocks - Gamuda

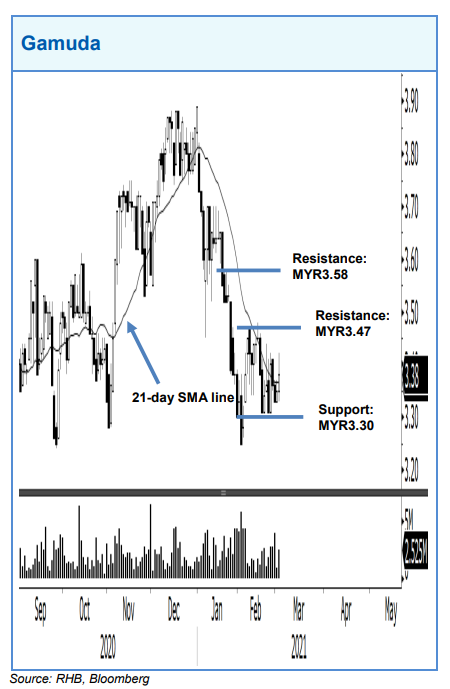
Gamuda has been trading in a possible sideways pattern over the past three weeks, and hovering around the 21-day SMA line. A positive bias is expected above MYR3.30, with resistance levels marked at MYR3.47 and MYR3.58. A downside breach of MYR3.30 would negate this positive expectation.
Source: RHB Securities Research - 3 Mar 2021
Related Stocks
| Chart | Stock Name | Last | Change | Volume |
|---|
Market Buzz
2024-11-24
GAMUDA2024-11-23
GAMUDA2024-11-22
GAMUDA2024-11-22
GAMUDA2024-11-22
GAMUDA2024-11-22
GAMUDA2024-11-21
GAMUDA2024-11-21
GAMUDA2024-11-21
GAMUDA2024-11-20
GAMUDA2024-11-20
GAMUDA2024-11-20
GAMUDA2024-11-20
GAMUDA2024-11-19
GAMUDA2024-11-19
GAMUDA2024-11-19
GAMUDA2024-11-19
GAMUDA2024-11-19
GAMUDA2024-11-18
GAMUDA2024-11-18
GAMUDA2024-11-18
GAMUDA2024-11-18
GAMUDA2024-11-15
GAMUDA2024-11-15
GAMUDA2024-11-15
GAMUDA2024-11-15
GAMUDA2024-11-15
GAMUDA2024-11-15
GAMUDA2024-11-15
GAMUDA2024-11-14
GAMUDA2024-11-14
GAMUDA2024-11-14
GAMUDA2024-11-14
GAMUDA2024-11-14
GAMUDA2024-11-13
GAMUDA2024-11-13
GAMUDA2024-11-13
GAMUDA2024-11-12
GAMUDA2024-11-12
GAMUDA2024-11-12
GAMUDA2024-11-12
GAMUDAMore articles on RHB Retail Research
Duopharma Biotech - Lacking Near-Term Re-Rating Catalysts; D/G NEUTRAL
Created by rhboskres | Aug 26, 2024
Discussions
Be the first to like this. Showing 0 of 0 comments
Post a Comment
Featured Posts
Introducing MY's First IPO Fund for Sophisticated Investors!
New Update. Discover investment communities that resonate with your ideas
M & A Value Partners IPO Equity Fund has been launched - Targeted 13% Return p.a
Latest Videos


Apps


Top Articles
2
3
4
save malaysia!
Visa-free travel to China extended for Malaysians to 30 days
5
6
Koon Yew Yin's Blog
CPO price is rising rapidly as shown by chart below - Koon Yew Yin
7
Axcapital's investment blog
KAB - Executing its way to a record quarter. Could more Petronas contracts be coming?
8
save malaysia!
#
Stock
Score
Daily Stocks
Stock Name
Last
Change
Volume
Stock Name
Last
Change
Volume
Stock Name
Last
Change
Volume
Featured Advertisers / Partners


Ride The Bull Short The Bear
CS Tan
4.9 / 5.0
This book is the result of the author's many years of experience and observation throughout his 26 years in the stockbroking industry. It was written for general public to learn to invest based on facts and not on fantasies or hearsay....