


AmInvest Research Reports
Stock on Radar - SDS Group (SDS Group)

AmInvest
Publish date: Thu, 06 Feb 2025, 09:30 AM
AmInvest
0 9,549
An official blog in I3investor to publish research reports provided by AmInvest research team.
All materials published here are prepared by AmInvest. For latest offers on AmInvest trading products and news, please refer to: https://www.aminvest.com/eng/Pages/home.aspx
Tel: +603 2036 1800 / +603 2032 2888
Fax: +603 2031 5210
Email: enquiries@aminvest.com
Office Hours
Monday to Thursday: 8:45am – 5:45pm
Friday: 8:45am – 5:00pm
(GMT +08:00 Malaysia)
SDS Group (SDS Group | 0212)
Last Price: RM1.23 | Technical Call: BUY
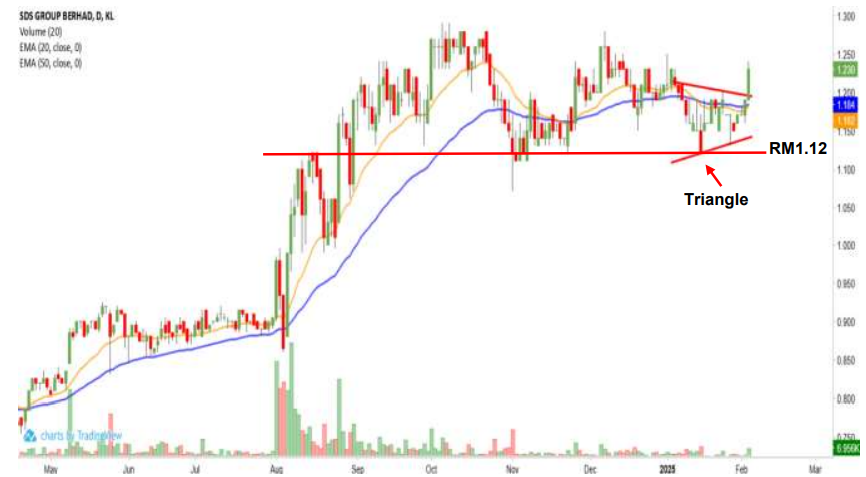
| Support 1: RM1.20 | Resistance 1: RM1.30 |
| Support 2: RM1.12 | Resistance 2: RM1.40 |
| Shariah Compliant: Yes | Sector: Consumer |
SDS Group broke out from its 1-month triangle pattern with a long positive candle yesterday, implying that a bullish reversal sign may have occurred. As the 20-day and 50-day EMAs are converging now and likely to confirm their bullish crossover soon, the current bullish momentum may persist in the near term. A bullish bias may emerge above the RM1.20 level with stop-loss set at RM1.10, below the 15 Jan low. Towards the upside, near-term resistance level is seen at RM1.30, followed by RM1.40.
Entry: RM1.20-1.23
Target: RM1.30, RM1.40
Exit: RM1.10
Source: AmInvest Research - 6 Feb 2025
Related Stocks
| Chart | Stock Name | Last | Change | Volume |
|---|
More articles on AmInvest Research Reports
Discussions
Be the first to like this. Showing 0 of 0 comments
Post a Comment
Featured Posts


Latest Videos


Apps


Top Articles
1
Stock Market Enthusiast
YTLPower: Hammer + Oversold + Strong Support Level Means Bullish Reversal?
2
CEO Morning Brief
These Big-cap Stocks on Bursa Pay More Than 5% Dividend Yield
3
Mercury Securities Research
4
RHB Investment Research Reports
5
6
MQ Market Updates
7
Bimb Research Highlights
MALAYSIA TOURISM - SHARIAH COMPLIANT EQUITY RESEARCH January 2025
8
博傻理论
#
Stock
Score
Daily Stocks
Stock Name
Last
Change
Volume
Stock Name
Last
Change
Volume
Stock Name
Last
Change
Volume
Featured Advertisers / Partners


Ride The Bull Short The Bear
CS Tan
4.9 / 5.0
This book is the result of the author's many years of experience and observation throughout his 26 years in the stockbroking industry. It was written for general public to learn to invest based on facts and not on fantasies or hearsay....