


WahLau Backtesting
High Volume Vs Low Volume (KLSE and Dow 30 / DJI)

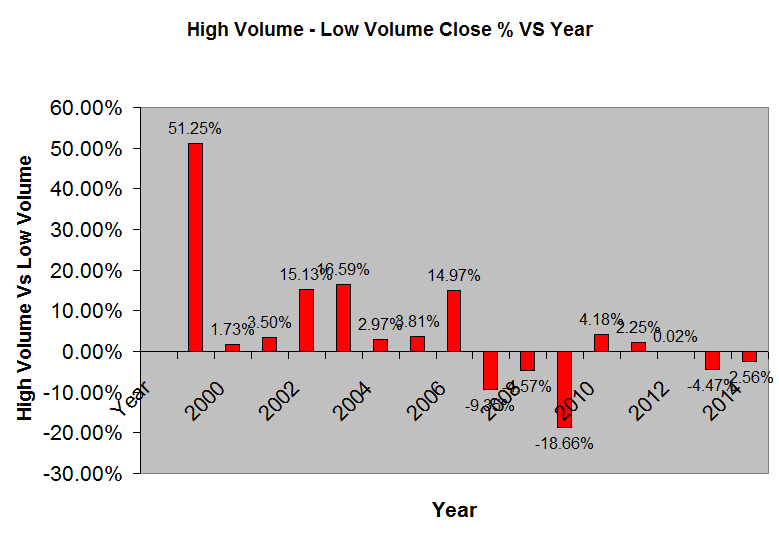
My previous blog can't really show advantage or disadvantage of buying point at low volume http://klse.i3investor.com/blogs/Backtesting/85017.jsp. Today backtesting is to compare buying point between a years. Data I taken from 1999 to 2014, and each year average of 10 lower volume and 10 higher volume.
For KLSE I take High Volume KLSE Close - Low Volume KSLE Close. KLSE results as below:
| Low Volume | High Volume |
High Volume - Low Volume (Close) |
High Volume - Low Volume Close % |
|||
| Year | Volume | Close | Volume | Close | ||
| 1999 | 10788370 | 511.349 | 177081480 | 773.41 | 262.06 | 51.25% |
| 2000 | 15463120 | 914.357 | 227157390 | 930.152 | 15.80 | 1.73% |
| 2001 | 20075940 | 621.775 | 124218440 | 643.515 | 21.74 | 3.50% |
| 2002 | 20811460 | 674.468 | 131326840 | 776.513 | 102.04 | 15.13% |
| 2003 | 18626220 | 648.484 | 184498580 | 756.037 | 107.55 | 16.59% |
| 2004 | 28527530 | 849.856 | 186411070 | 875.121 | 25.27 | 2.97% |
| 2005 | 35625900 | 888.987 | 132086370 | 922.86 | 33.87 | 3.81% |
| 2006 | 49515860 | 923.415 | 258900340 | 1061.654 | 138.24 | 14.97% |
| 2007 | 114628880 | 1339.01 | 462768880 | 1213.782 | -125.23 | -9.35% |
| 2008 | 97745340 | 1058.283 | 524048770 | 1009.921 | -48.36 | -4.57% |
| 2009 | 52219120 | 1254.997 | 702911320 | 1020.778 | -234.22 | -18.66% |
| 2010 | 54351840 | 1362.165 | 201415230 | 1419.093 | 56.93 | 4.18% |
| 2011 | 55239740 | 1483.253 | 294402620 | 1516.698 | 33.45 | 2.25% |
| 2012 | 78553180 | 1598.657 | 253748900 | 1598.95 | 0.29 | 0.02% |
| 2013 | 65092390 | 1810.085 | 314079100 | 1729.144 | -80.94 | -4.47% |
| 2014 | 68862650 | 1856.513 | 225969100 | 1808.906 | -47.61 | -2.56% |
| Avg | 49132971 | 1112.228 | 275064027 | 1128.533 | 16.31 | 4.80% |
| Year | Low Volume | High Volume |
High Volume - Low Volume (Close) |
High Volume - Low Volume Close % |
|||
| Volume | Close | Volume | Close | ||||
| Avg 1999 - 2006 | 24929300 | 754.0864 | 177710064 | 842.4077 | 88.32 | 13.74% | |
| Avg 2007 - 2014 | 73336643 | 1470.37 | 372417990 | 1414.659 | -55.71 | -4.15% | |
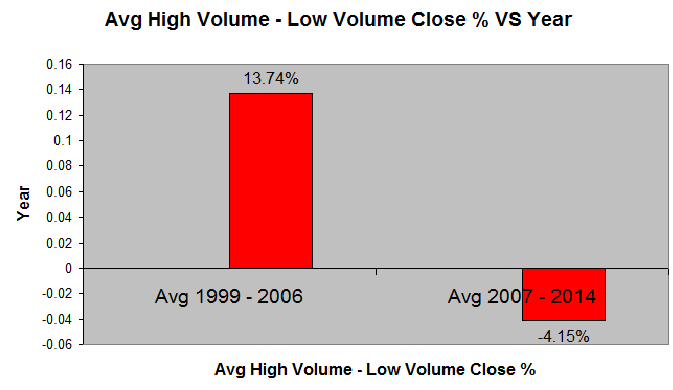
From 1999 until 2006 that chart showing high volume higher change get high KLSE point compare to low volume. Showing low volume is good buying point. But after 2007 Low volume don't mean low KLSE point of the year.
How about 2015 from 1/Jan/2015 until 1/Nov/2015
| Low Volume | High Volume | |||||
| Data | Volume | Close | Data | Volume | Close | |
| 15/5/2015 | 56989200 | 1811.92 | 7/10/2015 | 267171700 | 1689.25 | |
| 18/2/2015 | 62964300 | 1807.87 | 17/9/2015 | 266058500 | 1681.54 | |
| 3/4/2015 | 66470200 | 1834.52 | 29/5/2015 | 254439600 | 1747.52 | |
| 3/8/2015 | 67706700 | 1744.19 | 1/9/2015 | 252654300 | 1609.21 | |
| 13/7/2015 | 69578700 | 1716.11 | 9/10/2015 | 235294400 | 1706.54 | |
| 24/7/2015 | 74377600 | 1720.76 | 8/10/2015 | 222987900 | 1692.20 | |
| 16/7/2015 | 74418900 | 1726.73 | 25/8/2015 | 218974400 | 1563.94 | |
| 12/6/2015 | 74602300 | 1734.37 | 30/9/2015 | 214255400 | 1621.04 | |
| 27/7/2015 | 77096500 | 1709.76 | 23/1/2015 | 213716000 | 1803.08 | |
| 5/6/2015 | 78044000 | 1745.33 | 22/1/2015 | 212420500 | 1781.75 | |
| Avg | 70224840 | 1755.156 | Avg | 235797270 | 1689.607 | |
Data dont completed and taken from https://finance.yahoo.com/q/hp?s=%5EKLSE&a=00&b=1&c=2015&d=10&e=1&f=2015&g=d
If you know the better place to take data please advice and thanks.
*Low volume is good buying point is the idea from KLSE.8k ebook. This ebook is from 20/11/2000 until 31/3/2006. Klse.8k sifu I wish you can continue share your point of view. If you still continue share your point of view. Anyone if have new Klse.8k news please leave the link in command here.

Dow 30 data as below:
| Year | Low Volume | High Volume |
High Volume - Low Volume (Close) |
High Volume - Low Volume Close % |
||
| Volume | Close | Volume | Close | |||
| 1999 | 55462000 | 10805.96 | 202812000 | 10947.28 | 141.318 | 1.31% |
| 2000 | 123478000 | 10730.32 | 377558000 | 10375.69 | -354.634 | -3.30% |
| 2001 | 122799000 | 10313.84 | 455203000 | 9538.282 | -775.558 | -7.52% |
| 2002 | 144005000 | 9268.58 | 449594000 | 8412.68 | -855.9 | -9.23% |
| 2003 | 101905000 | 9710.011 | 329076000 | 8351.129 | -1358.88 | -13.99% |
| 2004 | 131659000 | 10356.66 | 364618000 | 10303.97 | -52.683 | -0.51% |
| 2005 | 160720000 | 10696.37 | 404015000 | 10517.56 | -178.817 | -1.67% |
| 2006 | 136704000 | 11979.16 | 484772000 | 11155.26 | -823.902 | -6.88% |
| 2007 | 130042000 | 13563.85 | 420849000 | 13102.19 | -461.661 | -3.40% |
| 2008 | 125925000 | 10596.05 | 551779000 | 10414.53 | -181.516 | -1.71% |
| 2009 | 114920000 | 10369.3 | 593187000 | 7417.217 | -2952.09 | -28.47% |
| 2010 | 94693000 | 11420.46 | 401829000 | 10577.6 | -842.858 | -7.38% |
| 2011 | 80775000 | 12136.89 | 399829000 | 11540.64 | -596.256 | -4.91% |
| 2012 | 69632000 | 13116.02 | 291220000 | 13000.52 | -115.498 | -0.88% |
| 2013 | 58632000 | 15838.57 | 282455000 | 14873.36 | -965.208 | -6.09% |
| 2014 | 52271000 | 17442.56 | 374858000 | 16530.06 | -912.501 | -5.23% |
Mostly showing low volume high Dow 30 point and not good buying point.
Base on today backtesting, Low volume is good buying point in KLSE cant use start from 2007. If you have any idea or view about this, please advice.
**Just sharing as study case and take your own risk to use it in your investment.
If your want to see more data check below:
KLSE
| Low Volume | High Volume | |||||
| Date | Volume | Close | Date | Volume | Close | |
| 03/31/99 | 6115300 | 502.82 | 04/27/99 | 205601700 | 670.02 | |
| 03/23/99 | 9850800 | 503.48 | 06/22/99 | 192057500 | 793.43 | |
| 03/22/99 | 10254800 | 507.55 | 06/28/99 | 183773100 | 820.71 | |
| 03/17/99 | 10473500 | 511.85 | 05/12/99 | 182064000 | 723.98 | |
| 03/16/99 | 10921300 | 511.9 | 05/20/99 | 174951200 | 779.62 | |
| 03/03/99 | 11414100 | 513.23 | 06/14/99 | 170774100 | 782.98 | |
| 03/19/99 | 11628700 | 513.91 | 06/16/99 | 169155800 | 791.91 | |
| 03/18/99 | 11663000 | 515.34 | 12/24/99 | 165226000 | 783.1 | |
| 03/04/99 | 12612700 | 516.59 | 06/24/99 | 163891800 | 801.72 | |
| 03/05/99 | 12949500 | 516.82 | 06/18/99 | 163319600 | 786.63 | |
| 10788370 | 511.349 | 177081480 | 773.41 | |||
| 01/25/00 | 14445200 | 952.06 | 03/14/00 | 451548000 | 932.05 | |
| 08/09/00 | 14542600 | 819.11 | 03/15/00 | 442762000 | 920.49 | |
| 01/24/00 | 14637400 | 954.5 | 12/14/00 | 349542000 | 712.5 | |
| 01/11/00 | 15265300 | 846.74 | 02/17/00 | 182854900 | 1006.82 | |
| 01/12/00 | 15293300 | 869.62 | 04/17/00 | 162789800 | 874.97 | |
| 02/02/00 | 15562000 | 942.85 | 02/28/00 | 145109800 | 983.77 | |
| 02/14/00 | 15913600 | 998.29 | 03/10/00 | 141978600 | 948.09 | |
| 02/22/00 | 16229100 | 1000.83 | 03/02/00 | 141259400 | 941.82 | |
| 02/21/00 | 16267500 | 1007.13 | 02/29/00 | 131722200 | 982.24 | |
| 11/10/00 | 16475200 | 752.44 | 02/16/00 | 122007200 | 998.77 | |
| 15463120 | 914.357 | 227157390 | 930.152 | |||
| 07/03/01 | 17079400 | 591.18 | 07/19/01 | 163401200 | 649.49 | |
| 03/16/01 | 17210600 | 672.01 | 07/05/01 | 138999400 | 617.14 | |
| 10/01/01 | 18629400 | 613.95 | 07/25/01 | 123725800 | 643.77 | |
| 11/06/01 | 20537400 | 592.75 | 07/06/01 | 123713200 | 626.81 | |
| 05/28/01 | 20823000 | 566.09 | 08/27/01 | 121996200 | 694.22 | |
| 11/07/01 | 20897800 | 592.26 | 07/26/01 | 121132800 | 642.79 | |
| 12/24/01 | 21162600 | 669.58 | 07/18/01 | 119944600 | 647.72 | |
| 02/26/01 | 21384200 | 710.94 | 07/20/01 | 113721600 | 648.78 | |
| 10/29/01 | 21515000 | 605.8 | 12/05/01 | 109358800 | 653.01 | |
| 10/30/01 | 21520000 | 603.19 | 05/02/01 | 106190800 | 611.42 | |
| 20075940 | 621.775 | 124218440 | 643.515 | |||
| 12/24/02 | 16168400 | 641.16 | 04/17/02 | 167122200 | 792.14 | |
| 09/02/02 | 18752400 | 713.4 | 04/15/02 | 144255800 | 784.54 | |
| 08/08/02 | 19411200 | 722.5 | 04/23/02 | 135703600 | 808.07 | |
| 12/23/02 | 21095200 | 639.2 | 04/19/02 | 132277200 | 798.35 | |
| 01/02/02 | 21151600 | 682.83 | 04/08/02 | 124475400 | 772.26 | |
| 12/11/02 | 21787800 | 635.17 | 04/11/02 | 124411000 | 774.76 | |
| 08/07/02 | 22147800 | 721.65 | 03/11/02 | 123879200 | 761.01 | |
| 07/29/02 | 22194400 | 720.98 | 04/09/02 | 121790800 | 775.88 | |
| 10/11/02 | 22660200 | 637.78 | 02/04/02 | 120115200 | 723.54 | |
| 10/14/02 | 22745600 | 630.01 | 04/10/02 | 119238000 | 774.58 | |
| 20811460 | 674.468 | 131326840 | 776.513 | |||
| 01/02/03 | 14224200 | 632.43 | 10/10/03 | 268086800 | 790.66 | |
| 04/21/03 | 16131200 | 634.3 | 10/09/03 | 267926600 | 779.41 | |
| 04/18/03 | 17275200 | 635.61 | 07/03/03 | 251305600 | 721.93 | |
| 01/03/03 | 18595800 | 633.5 | 07/07/03 | 171304800 | 730.4 | |
| 01/08/03 | 18972600 | 625.13 | 07/04/03 | 170159000 | 725.11 | |
| 05/05/03 | 19776800 | 631.41 | 10/22/03 | 156334800 | 805.11 | |
| 02/24/03 | 19780600 | 651.56 | 07/08/03 | 150321600 | 727 | |
| 04/22/03 | 20232800 | 632.99 | 10/08/03 | 147042400 | 759.62 | |
| 12/26/03 | 20624600 | 780.02 | 10/13/03 | 131798600 | 791.74 | |
| 01/06/03 | 20648400 | 627.89 | 07/15/03 | 130705600 | 729.39 | |
| 18626220 | 648.484 | 184498580 | 756.037 | |||
| 12/27/04 | 19970400 | 906.89 | 02/18/04 | 265590800 | 857.15 | |
| 01/02/04 | 25085200 | 788.49 | 02/24/04 | 215346000 | 874.82 | |
| 12/29/04 | 26815700 | 907.58 | 11/18/04 | 197033000 | 904.48 | |
| 10/15/04 | 27412600 | 851.29 | 02/26/04 | 184323200 | 885.34 | |
| 07/19/04 | 28031000 | 843.15 | 02/19/04 | 173749200 | 858.66 | |
| 05/31/04 | 29680600 | 810.67 | 03/02/04 | 173345200 | 894.45 | |
| 12/28/04 | 30144200 | 906.55 | 02/25/04 | 164365000 | 872.03 | |
| 06/28/04 | 32228600 | 822.22 | 11/17/04 | 164178700 | 901.66 | |
| 10/14/04 | 32584400 | 852.16 | 03/03/04 | 163122800 | 877.2 | |
| 08/18/04 | 33322600 | 809.56 | 01/09/04 | 163056800 | 825.42 | |
| 28527530 | 849.856 | 186411070 | 875.121 | |||
| 03/25/05 | 25111600 | 883.4 | 07/22/05 | 259228200 | 939.69 | |
| 12/27/05 | 28286400 | 894.51 | 08/03/05 | 140736000 | 952.59 | |
| 03/28/05 | 32397600 | 885.44 | 11/07/05 | 124600800 | 911.53 | |
| 02/08/05 | 37158800 | 914.91 | 10/19/05 | 122799200 | 914.17 | |
| 12/19/05 | 37675200 | 895.86 | 07/25/05 | 121216400 | 939.84 | |
| 06/07/05 | 37811000 | 876.92 | 01/12/05 | 115094100 | 933.33 | |
| 05/30/05 | 38929200 | 869.96 | 07/20/05 | 111158400 | 924.01 | |
| 12/23/05 | 39075600 | 892.13 | 05/04/05 | 109646000 | 903.07 | |
| 05/19/05 | 39463800 | 887.47 | 12/01/05 | 109014600 | 887.8 | |
| 05/16/05 | 40349800 | 889.27 | 09/21/05 | 107370000 | 922.57 | |
| 35625900 | 888.987 | 132086370 | 922.86 | |||
| 01/03/06 | 21876000 | 892.85 | 11/30/06 | 369717000 | 1080.66 | |
| 01/04/06 | 44177800 | 897.13 | 12/06/06 | 285376500 | 1098.35 | |
| 08/09/06 | 46926400 | 941.26 | 12/01/06 | 275056500 | 1080.11 | |
| 06/23/06 | 51364000 | 906.34 | 11/16/06 | 247882300 | 1037.6 | |
| 08/15/06 | 51562200 | 943.94 | 11/20/06 | 244308000 | 1033.52 | |
| 04/14/06 | 53755800 | 938.32 | 05/09/06 | 239606000 | 966.88 | |
| 08/08/06 | 54620400 | 939.08 | 12/05/06 | 236627600 | 1088.96 | |
| 08/14/06 | 56106200 | 946 | 12/04/06 | 232580300 | 1077.44 | |
| 07/21/06 | 56186000 | 924.72 | 11/29/06 | 229599500 | 1064.6 | |
| 06/26/06 | 58583800 | 904.51 | 12/12/06 | 228249700 | 1088.42 | |
| 49515860 | 923.415 | 258900340 | 1061.654 | |||
| 09/17/07 | 87764800 | 1278.34 | 02/28/07 | 614671400 | 1196.45 | |
| 04/06/07 | 107238200 | 1278.92 | 02/09/07 | 507302100 | 1240.87 | |
| 09/11/07 | 113373200 | 1286.33 | 02/15/07 | 478470300 | 1258.63 | |
| 11/19/07 | 116242300 | 1379.91 | 03/05/07 | 465388900 | 1110.69 | |
| 11/23/07 | 117493200 | 1353.55 | 02/27/07 | 458939400 | 1237.08 | |
| 11/26/07 | 119716700 | 1364.37 | 08/17/07 | 457989100 | 1191.55 | |
| 11/27/07 | 120212200 | 1364.99 | 02/08/07 | 443598700 | 1248.83 | |
| 09/14/07 | 120738500 | 1289.5 | 08/16/07 | 430892000 | 1207.61 | |
| 10/19/07 | 121555100 | 1370.17 | 02/06/07 | 390444000 | 1236.63 | |
| 12/26/07 | 121954600 | 1424.02 | 02/02/07 | 379992900 | 1209.48 | |
| 114628880 | 1339.01 | 462768880 | 1213.782 | |||
| 12/26/08 | 55986200 | 867.35 | 10/16/08 | 623167200 | 920.02 | |
| 12/24/08 | 62647600 | 869.62 | 03/10/08 | 558533100 | 1173.22 | |
| 12/30/08 | 95932800 | 881.63 | 10/30/08 | 551642400 | 853.56 | |
| 08/26/08 | 103517900 | 1070.5 | 01/11/08 | 543175500 | 1516.22 | |
| 03/21/08 | 105239200 | 1189.06 | 11/04/08 | 530705400 | 905.58 | |
| 06/17/08 | 105609500 | 1227.76 | 10/24/08 | 512472000 | 859.11 | |
| 08/12/08 | 110954500 | 1118.78 | 11/03/08 | 487645900 | 899.35 | |
| 12/16/08 | 111818700 | 854.8 | 10/31/08 | 485047400 | 863.61 | |
| 08/27/08 | 112367200 | 1067.65 | 05/30/08 | 481188900 | 1276.1 | |
| 01/02/08 | 113379800 | 1435.68 | 10/28/08 | 466909900 | 832.44 | |
| 97745340 | 1058.283 | 524048770 | 1009.921 | |||
| 12/24/09 | 41488600 | 1263.94 | 05/11/09 | 816858900 | 1025.5 | |
| 12/23/09 | 43686000 | 1260.53 | 05/07/09 | 764863000 | 1023.47 | |
| 12/29/09 | 47798000 | 1275.22 | 05/29/09 | 761773800 | 1044.11 | |
| 12/28/09 | 49237800 | 1272.73 | 05/05/09 | 724748300 | 1008.87 | |
| 09/29/09 | 51999600 | 1208.21 | 05/13/09 | 722877400 | 1022.84 | |
| 11/13/09 | 54833600 | 1270.96 | 05/06/09 | 702251900 | 1023.96 | |
| 12/30/09 | 57402600 | 1271.12 | 06/02/09 | 662632500 | 1063.62 | |
| 10/12/09 | 57814200 | 1233.33 | 04/30/09 | 627659400 | 990.74 | |
| 12/22/09 | 58808000 | 1260.42 | 05/14/09 | 623401500 | 1011.99 | |
| 10/13/09 | 59122800 | 1233.51 | 04/24/09 | 622046500 | 992.68 | |
| 52219120 | 1254.997 | 702911320 | 1020.778 | |||
| 12/24/10 | 45783400 | 1511.58 | 12/10/10 | 277808000 | 1507.28 | |
| 12/27/10 | 45943800 | 1511.72 | 12/09/10 | 209160800 | 1521.29 | |
| 06/14/10 | 51568800 | 1297.16 | 12/08/10 | 205107600 | 1510.06 | |
| 06/28/10 | 53813200 | 1325.54 | 09/01/10 | 194903000 | 1431.96 | |
| 04/26/10 | 54767400 | 1340.07 | 03/08/10 | 194749000 | 1324.22 | |
| 04/23/10 | 56413400 | 1336.78 | 05/26/10 | 194649700 | 1248.94 | |
| 06/25/10 | 56493800 | 1326.45 | 11/12/10 | 189206600 | 1499.81 | |
| 01/04/10 | 56508200 | 1275.75 | 08/30/10 | 183197800 | 1422.49 | |
| 04/02/10 | 60418400 | 1335.94 | 09/22/10 | 182785900 | 1474.75 | |
| 08/09/10 | 61808000 | 1360.66 | 05/25/10 | 182583900 | 1250.13 | |
| 54351840 | 1362.165 | 201415230 | 1419.093 | |||
| 12/27/11 | 41876000 | 1500.91 | 05/31/11 | 404034600 | 1558.29 | |
| 12/28/11 | 45030000 | 1504.11 | 08/09/11 | 325011000 | 1472.14 | |
| 04/25/11 | 45114800 | 1524.05 | 08/05/11 | 316934000 | 1524.43 | |
| 10/10/11 | 54891000 | 1397.04 | 01/05/11 | 316364200 | 1566.17 | |
| 12/19/11 | 57540000 | 1477.78 | 08/08/11 | 313999000 | 1496.99 | |
| 12/23/11 | 57780600 | 1496.15 | 01/07/11 | 265674400 | 1572.21 | |
| 11/11/11 | 61556600 | 1468.75 | 08/10/11 | 264453600 | 1480.52 | |
| 12/29/11 | 62334800 | 1506.69 | 01/21/11 | 251428600 | 1547.43 | |
| 12/12/11 | 63036800 | 1467.1 | 08/26/11 | 249168400 | 1444.81 | |
| 12/05/11 | 63236800 | 1489.95 | 02/10/11 | 236958400 | 1503.99 | |
| 55239740 | 1483.253 | 294402620 | 1516.698 | |||
| 12/26/12 | 58336600 | 1671.58 | 02/29/12 | 329668800 | 1569.65 | |
| 08/27/12 | 77450000 | 1648.13 | 05/31/12 | 310723800 | 1580.67 | |
| 01/03/12 | 77480000 | 1513.54 | 08/07/12 | 279393800 | 1631.12 | |
| 08/28/12 | 77849600 | 1647.11 | 09/14/12 | 252363200 | 1642.95 | |
| 10/15/12 | 80400800 | 1654.44 | 11/30/12 | 237455400 | 1610.83 | |
| 04/06/12 | 80618400 | 1598.87 | 03/30/12 | 232123200 | 1596.33 | |
| 12/24/12 | 80711200 | 1669.4 | 09/13/12 | 230334400 | 1628.4 | |
| 05/28/12 | 83517200 | 1554.94 | 02/08/12 | 230225200 | 1553.18 | |
| 01/06/12 | 83640000 | 1514.13 | 09/18/12 | 219796800 | 1640.33 | |
| 01/05/12 | 85528000 | 1514.43 | 05/16/12 | 215404400 | 1536.04 | |
| 78553180 | 1598.657 | 253748900 | 1598.95 | |||
| 12/26/13 | 39266500 | 1844.1 | 05/06/13 | 460879200 | 1752.02 | |
| 12/24/13 | 43420400 | 1835.49 | 05/31/13 | 321700800 | 1769.22 | |
| 12/23/13 | 58940900 | 1832.86 | 06/21/13 | 313697800 | 1755.85 | |
| 12/27/13 | 68685700 | 1861.06 | 05/07/13 | 311994800 | 1776.73 | |
| 11/04/13 | 71274700 | 1807.47 | 08/20/13 | 310561400 | 1745.42 | |
| 08/07/13 | 71763400 | 1779.32 | 08/28/13 | 304554700 | 1686.17 | |
| 10/14/13 | 73069900 | 1784.76 | 08/22/13 | 280926100 | 1720.37 | |
| 10/03/13 | 73213800 | 1771.37 | 03/15/13 | 280042600 | 1627.64 | |
| 11/28/13 | 73856200 | 1807.6 | 04/03/13 | 279277600 | 1685.4 | |
| 10/07/13 | 77432400 | 1776.82 | 07/31/13 | 277156000 | 1772.62 | |
| 65092390 | 1810.085 | 314079100 | 1729.144 | |||
| 04/18/14 | 50634500 | 1852.69 | 05/30/14 | 477552300 | 1873.38 | |
| 05/06/14 | 61088900 | 1860.43 | 03/21/14 | 238355500 | 1820.48 | |
| 04/21/14 | 64269300 | 1862.93 | 01/27/14 | 221453700 | 1778.88 | |
| 01/02/14 | 66306000 | 1852.95 | 08/29/14 | 206340200 | 1866.11 | |
| 05/05/14 | 71044900 | 1860.54 | 04/30/14 | 194367200 | 1871.52 | |
| 07/25/14 | 71808400 | 1877.34 | 10/17/14 | 191013400 | 1788.31 | |
| 10/03/14 | 74837000 | 1840.82 | 01/16/14 | 188760700 | 1813.01 | |
| 07/23/14 | 75032300 | 1871.83 | 10/16/14 | 181474400 | 1767.77 | |
| 07/01/14 | 76764400 | 1879.12 | 02/28/14 | 180935100 | 1835.66 | |
| 11/17/14 | 76840800 | 1806.48 | 12/16/14 | 179438500 | 1673.94 | |
| 68862650 | 1856.513 | 225969100 | 1808.906 | |||
More articles on WahLau Backtesting
"Buy when everyone is fearful" backtesting in FKLI/ DOW 30/ HSI or SE001
Created by Wah Lau | Nov 12, 2015
Discussions
Be the first to like this. Showing 0 of 0 comments
Post a Comment
Featured Posts
Introducing MY's First IPO Fund for Sophisticated Investors!
New Update. Discover investment communities that resonate with your ideas
M & A Value Partners IPO Equity Fund has been launched - Targeted 13% Return p.a
Latest Videos


Apps


Top Articles
1
BFM Podcast
2
Koon Yew Yin's Blog
4
CGS-CIMB Research
Genting Plantations - Proposed Land Acquisition in Indonesia
5
6
Initial Public Offering (IPO)
8
Koon Yew Yin's Blog
#
Stock
Score
Daily Stocks
Stock Name
Last
Change
Volume
Stock Name
Last
Change
Volume
Stock Name
Last
Change
Volume
MQ Trading Signals
Stock
Time
Signal
Duration
Stock
Time
Signal
Duration
Featured Advertisers / Partners


Ride The Bull Short The Bear
CS Tan
4.9 / 5.0
This book is the result of the author's many years of experience and observation throughout his 26 years in the stockbroking industry. It was written for general public to learn to invest based on facts and not on fantasies or hearsay....