


https://dividendguy67.blogspot.com
KLCI Index - June Update

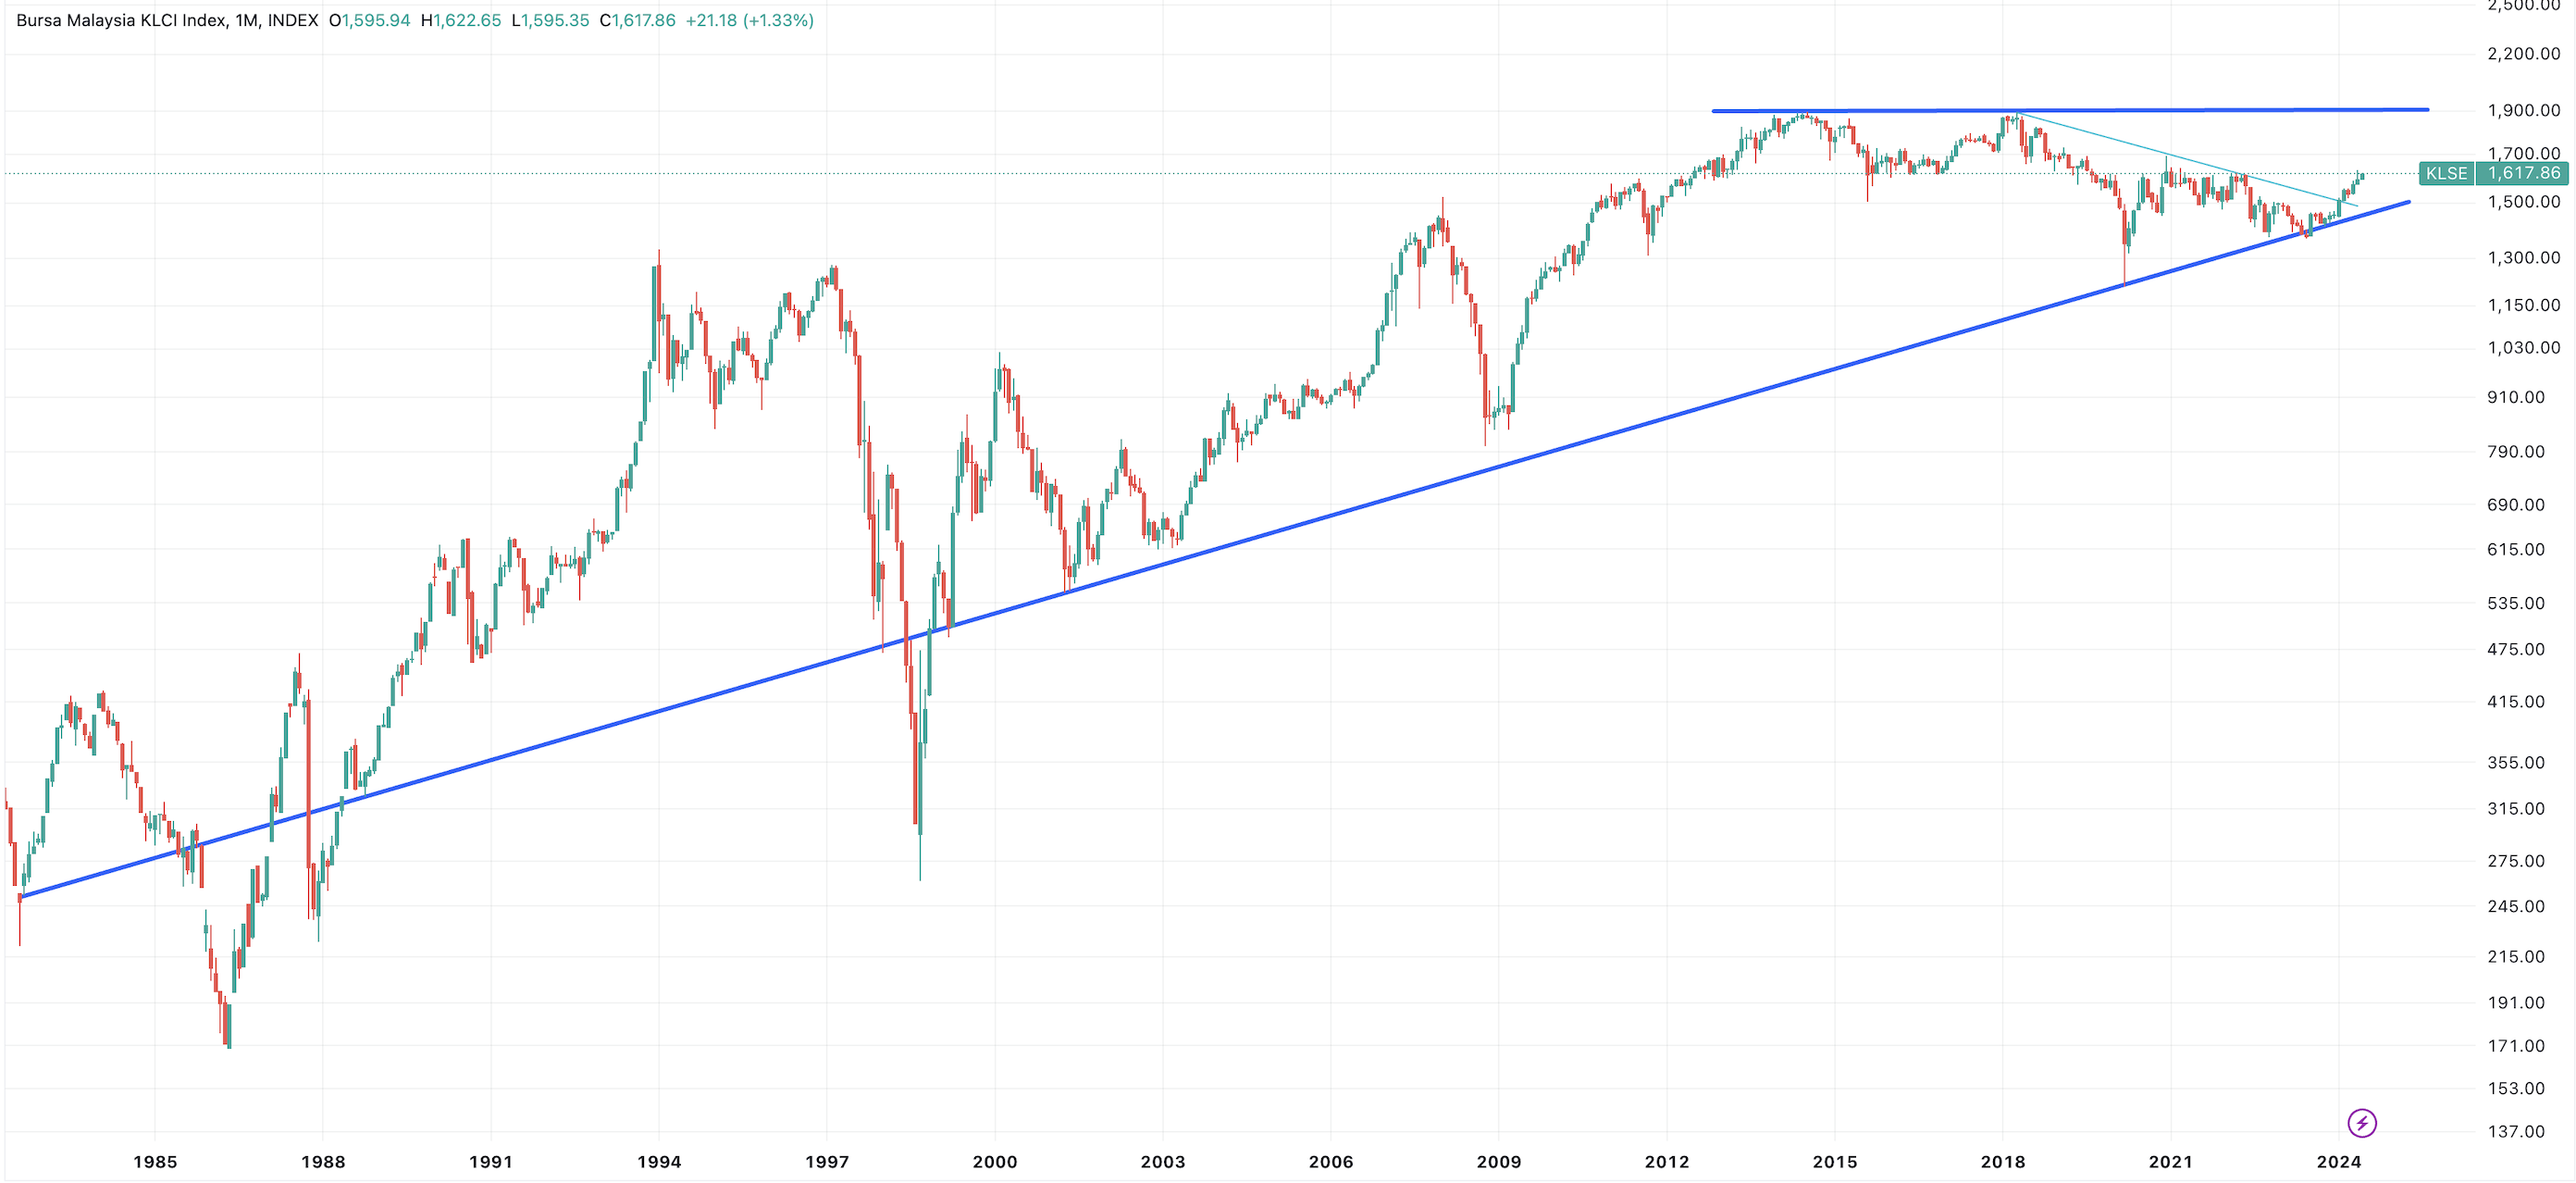
Last month, I shared my views on KLCI index here. In that article, I asked whether is it peaking and should you sell. At the time, the KLCI index shown at the charts was 1603. My observation was a simple one - when tuning out to 30 year monthly candle charts, there's nothing to do but just sit tight.
What has transpired over the 3-4 weeks since then?
1 word - "noise", ie. long term investors can ignore.
(short term traders will make comments like ... it subsequently went up as high as 1,632. Then, fell down to a low of 1,595. It is now back up to 1,617. Basically zig up, zag down and zig back up in what appears like a consolidation pattern. There is also a potential bear trap when it broke below 1,600 but buying pressures quickly came back in to push the index above 1,600. Bears and bulls are still fighting in this consolidation zone, but the trend is unmistakeable bull trend, perhaps a bit too fast and so, some consolidation is healthy. We are in/approaching the generally higher earnings QR season too (at least for my 50+ holdings) and market needs to make up its mind. etc. .... but all these are "noise" for the long term growth/value/dividend investor).

How do we know for sure it is "noise"?
Compare the updated Monthly Chart below, vs previous article's.
To me, they look awfully the same, hence "noise".
Disclaimer: As usual, you are fully responsible for your trading and investing decisions.
More articles on https://dividendguy67.blogspot.com
MSTR Options Report Card as of Jan 31, 2025 - $4,153 profits so far!
Created by DividendGuy67 | Feb 02, 2025
IBIT Positions as at 24 Jan 2025 - Paper Gains $8,680 in a month!
Created by DividendGuy67 | Jan 25, 2025
How I created US$4,855 "dividend" income in less than 30 minutes
Created by DividendGuy67 | Jan 24, 2025
Happy January! Trump inaugurated, account new all time highs
Created by DividendGuy67 | Jan 22, 2025
Discussions
Be the first to like this. Showing 0 of 0 comments
Post a Comment
Featured Posts
Introducing MY's First IPO Fund for Sophisticated Investors!
New Update. Discover investment communities that resonate with your ideas
M & A Value Partners IPO Equity Fund has been launched - Targeted 13% Return p.a
Latest Videos


Apps


Top Articles
1
Dragon Leong blog
2
Stock Market Enthusiast
Feng Shui Market Outlook for FBM KLCI in the Year of the Wood Snake (2025)
3
The Alpha Trader
5
Stock Market Enthusiast
3 Resilient Stocks That Defied Malaysia’s Market Slump in January 2025 - #GCB, #ABMB, #CDB
6
THE INVESTMENT APPROACH OF CALVIN TAN
REPOSTING: BUSINESSES THAT LAST TILL THE END OF TIME IN BIBLE PROPHECY, Calvin Tan Blog
8
MQ Market Updates
#
Stock
Score
Daily Stocks
Stock Name
Last
Change
Volume
Stock Name
Last
Change
Volume
Stock Name
Last
Change
Volume
MQ Trading Signals
Stock
Time
Signal
Duration
No trading signals available.
Stock
Time
Signal
Duration
No trading signals available.
Featured Advertisers / Partners


Ride The Bull Short The Bear
CS Tan
4.9 / 5.0
This book is the result of the author's many years of experience and observation throughout his 26 years in the stockbroking industry. It was written for general public to learn to invest based on facts and not on fantasies or hearsay....