


ECOMMERCE
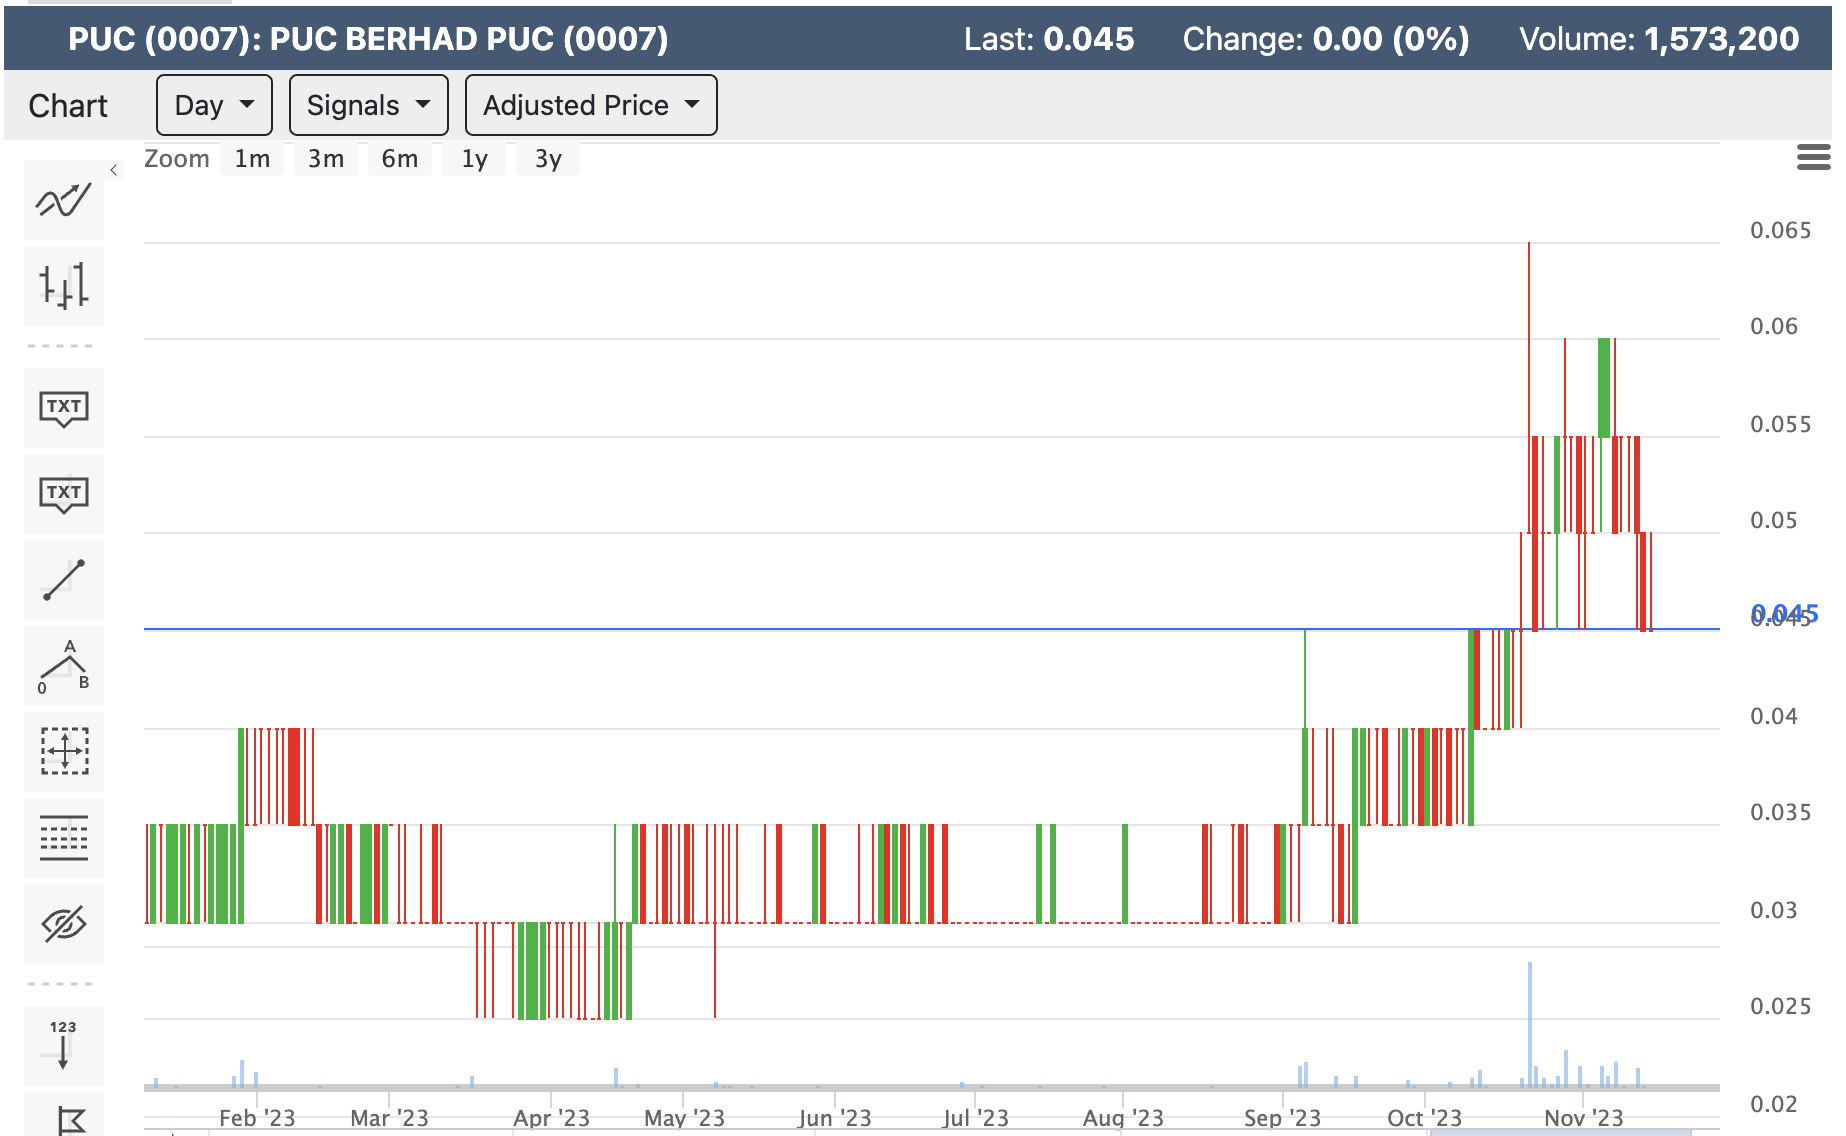
PUC Berhad's Technical Analysis: A Potential Turnaround?

Summary of Indicators.
The overall analysis leans towards bearishness with 19 sell, 2 buy, and 1 neutral signal.
Technical Indicators. A mix of signals is observed, including 7 sell, 2 buy, and 1 neutral signal. Key indicators include RSI (44.885, sell), Stochastics (66.667, buy), MACD (-0.002, sell), and ADX (22.508, buy), painting a diverse picture.
Moving Averages. All moving averages (MA5, MA10, MA20, MA50, MA100, MA200) are indicating sell signals, suggesting a bearish trend in the short, medium, and long term.
Pivot Points: Across various methods (Classic, Fibonacci, Camarilla, Woodie's, DeMark's), the pivot point levels are consistent at 0.05. This may serve as both a support and resistance level, indicating potential turning points for the stock.
The current technical analysis reflects a bearish sentiment. However, PUC Berhad's recent partnership with a leading e-wallet operator could be a significant factor in reevaluating this outlook. Such collaborations can drive positive market sentiment and potentially lead to a bullish turnaround, especially in a digitally evolving economy. Investors might view this partnership as a catalyst for growth, possibly changing the technical outlook in the near future.
More articles on ECOMMERCE
PUC Returns to Profitability Following Touch N’ Go Collaboration
Created by AnthonyAng666 | Dec 04, 2023
Discussions
Be the first to like this. Showing 0 of 0 comments
Post a Comment
Featured Posts


Latest Videos


Apps


Top Articles
1
2
CEO Morning Brief
3
CEO Morning Brief
4
Good Articles to Share
‘THINGS ARE GETTING WORSE’: Credit card debt skyrocketing to concerning levels #shorts
5
Mercury Securities Research
6
Good Articles to Share
Nvidia's Blackwell could propel 2025 revenue to $200B: Strategist
7
Good Articles to Share
Stock market today: Dow, S&P 500, Nasdaq fall as comeback bid falters and Tesla, Apple slide
8
Good Articles to Share
#
Stock
Score
Daily Stocks
Stock Name
Last
Change
Volume
Stock Name
Last
Change
Volume
Stock Name
Last
Change
Volume
MQ Trading Signals
Stock
Time
Signal
Duration
Stock
Time
Signal
Duration
Featured Advertisers / Partners


Ride The Bull Short The Bear
CS Tan
4.9 / 5.0
This book is the result of the author's many years of experience and observation throughout his 26 years in the stockbroking industry. It was written for general public to learn to invest based on facts and not on fantasies or hearsay....