


KLCI waves
KLCI waves 18 - Two phenomenon waves

hotstock1975
Publish date: Mon, 03 Aug 2020, 01:20 AM
hotstock1975
0 101
Elliot wave analysis to measure price behavior for projecting next price actions
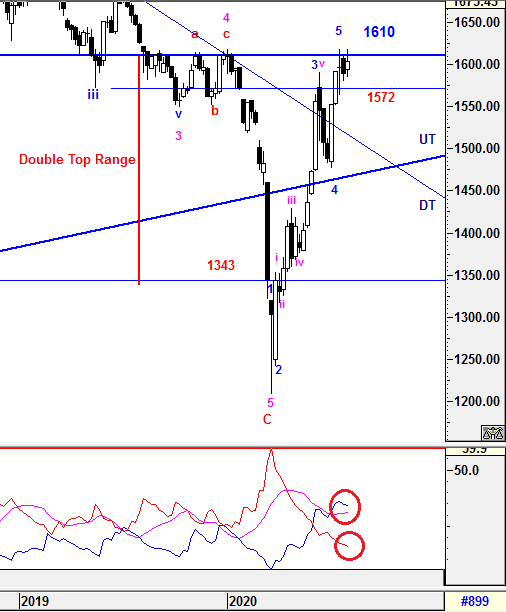
Monthly Time Frame

As expected, the momentum built up from the succeeded piercing line candle formation led to an continouos upside to overwrite the shooting star candle formed on prior month. Currently, it was resisted at 1610 which was the neck line of the initial double top formation and it would be better off if KLCI could close above 1610 convincingly to spur some strenght for further upside.
The new Bull Wave Cycle is still valid and expecting some knee jerk reactions along the cycle.
Prevailing trend could be emerged if levels listed below was broken:
Resistance : 1610
Support : 1588,1560, 1480 (UT line)
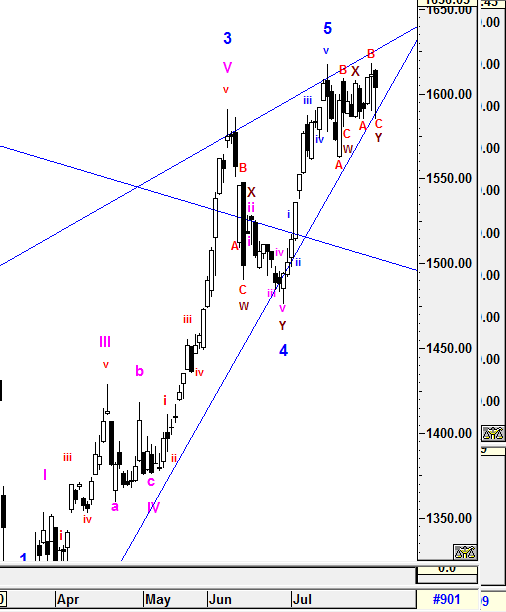
Weekly Time Frame
KLCI was still hovering below 1610 and trend has yet to be decided unless the prior Bearish Engulfing formation's low of 1580.39 broken. Therefore, the prior Double Top Range effect written off hope is still put on hold until 1610 is breached.
On the other hand, the higher degree of correction will be elaborated further in daily time frame.
-DMI (red line) is still heading down narrowly indicates bearish momentum is decreasing slowly. +DMI (blue line) is still heading down indicates bull strenght is slowing down. ADX (pink line) is still curving up which implying the volatility of the current bull trend increasing. Therefore the 3 signals above are implying directionless in trend and knee jerk reaction is unavoidable as expected.
Prevailing trend could be emerged if levels listed below was broken:
Resistance - 1610
Support - 1580.39, 1572
Daily Time Frame
Phenomenon 1
Phenomenon 2
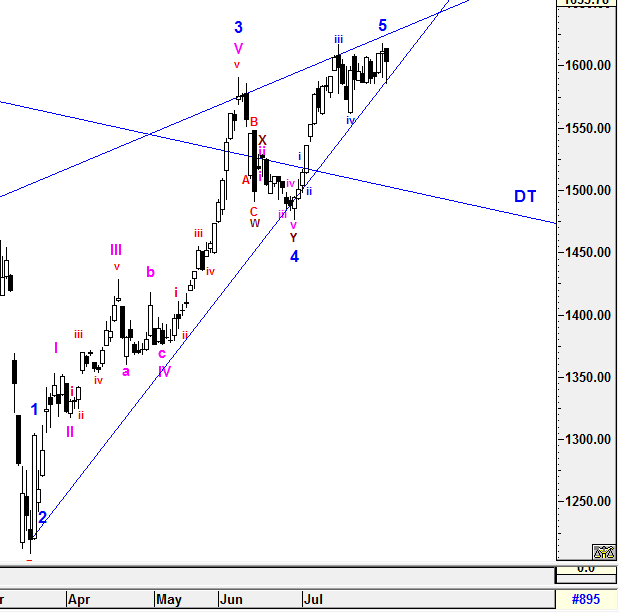
To recap, wave C was being monitored closely as it has the most potential properties of waves which may lead to complex waves formations such as WXY during the higher degree of correction. No doubt that a potential complex waves forms had identified with combination of 2 correction waves which was ABC-X-ABC as illustrated above. However, there was another potential wave counts which the prior higher degree of 5th wave might just be realized and new correction waves might have just started. These two phenomenon waves incurred because of the magnitude of the waves has changed and may need further signal to quantify the complexity. As mentioned on prior 2 sessions, i would not rule out that higher degree of 5th wave could be resurface due to the variation degree of the magnitude. Still, the ascending wedges formation will give us more clues for any pending waves to be quantified accurately.
All waves' count and projected target are generated based on past/current price level and it may be subjected to vary if degree of momentum movement change.
Prevailing trend could be emerged if levels listed below was broken:
Immediate resistance - 1610
Immediate support - 1595
Support - 1586, 1563.01
Let's Mr Market pave the waves.
Trade safely
Wave Believer
More articles on KLCI waves
KLCI waves 94 - WILL THE DOWNWARD PRESSURE TO BE IMPULSIVE TOWARDS WAVE E?
Created by hotstock1975 | Jan 24, 2022
KLCI waves 93 - EXTENSION UPWARD ENDED AND IT'S TIME TO THE DOWNSIDE?
Created by hotstock1975 | Jan 17, 2022
KLCI waves 89 - KLCI WILL EXTEND AND HIT LOWER TARGETS GRADUALLY
Created by hotstock1975 | Dec 20, 2021
Discussions
Be the first to like this. Showing 1 of 1 comments
Post a Comment
Featured Posts


Latest Videos


Apps


Top Articles
1
2
3
Koon Yew Yin's Blog
4
THE INVESTMENT APPROACH OF CALVIN TAN
5
save malaysia!
7
8
CEO Morning Brief
#
Stock
Score
Daily Stocks
Stock Name
Last
Change
Volume
Stock Name
Last
Change
Volume
Stock Name
Last
Change
Volume
MQ Trading Signals
Stock
Time
Signal
Duration
Stock
Time
Signal
Duration
Featured Advertisers / Partners


Ride The Bull Short The Bear
CS Tan
4.9 / 5.0
This book is the result of the author's many years of experience and observation throughout his 26 years in the stockbroking industry. It was written for general public to learn to invest based on facts and not on fantasies or hearsay....
abang_misai
Run
2020-08-03 05:27