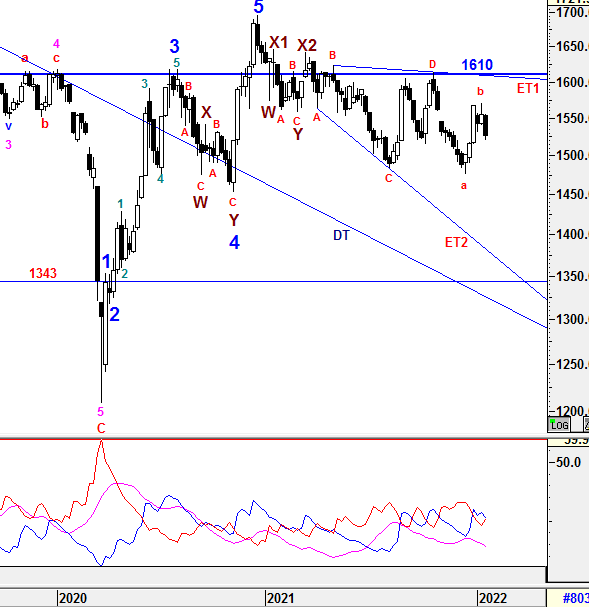
Weekly Time Frame
To recap from prior session 93, KLCI continued to consolidate within the Gap Support region of 1559.66 and 1545.99.
{{{{{{{{{{{{{{{{{{{{{{{{{{{{{{{{{{{{{{{{{{{{{{{{{{{{
For the past one week, weaker sentiment to drive KLCI lower after consolidated within Gap Support region for 2 weeks and expecting weaknesses ahead after breached below the region. Let's check the temperature of the trend.
TREND indicators
1) -DMI (red line) curved up with greater margin indicates bear strength is increasing with greater pace.
2) +DMI (blue line) curved down with consistent margin indicates bull strength is decreasing with consistent pace.
3) ADX (pink line) is still heading down with consistent margin implying that the volatility of the current trend is decreasing with consistent margin and weak.
+DMI has stayed above -DMI for the fourth week indicating the BULL strength is still in control but not firmed yet as ADX is showing sign of slowness of the volatility of current trend. I am still assuming KLCI is still in the huge consolidating phase in between revised ET1 and ET2 expanding triangle in Medium Term which bias to the downside as any rebound would not be as solid trend reversal. Therefore, caution is still required unless ET1 or 1610 could be penetrated to the upside CONVINCINGLY.
}}}}}}}}}}}}}}}}}}}}}}}}}}}}}}}}}}}}}}}}}}}}}}}}}}}}
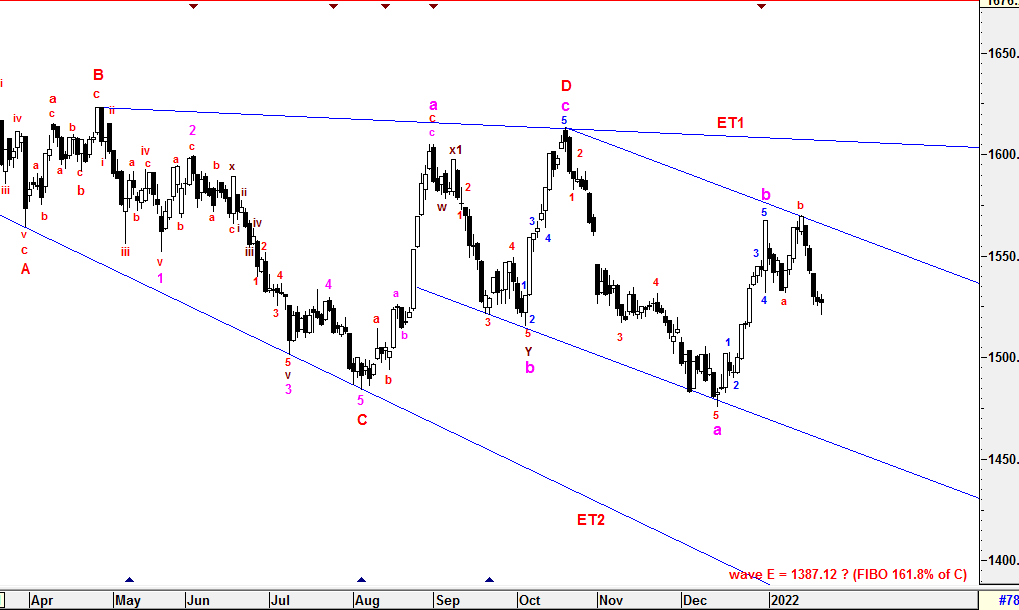
From wave count perspective, the Higher Degree of Correction wave would be prolong with Multiple WXYXZ complex waves before a new set of Higher Degree of Bull Wave take place. Besides that, wave D has been justified to end at 1604.98 and wave E might be in its way to the downside. Therefore, Wave Z is still not been realized yet. Subsequent minor waves would be elaborated further in daily time frame.
Prevailing trend could be emerged if Weekly levels listed below was broken:
Resistance - 1610, 1615, 1619, 1627, 1633, 1642, 1650, 1700, 1720
Immediate Resistance - 1531, 1543, 1556.28, 1560, 1571, 1575, 1580, 1590, 1595, 1600
Immediate Support - 1525, 1515, 1505-1508, 1500, 1484-1488, 1474-1476, 1466
Support - 1452, 1447, 1436, 1407
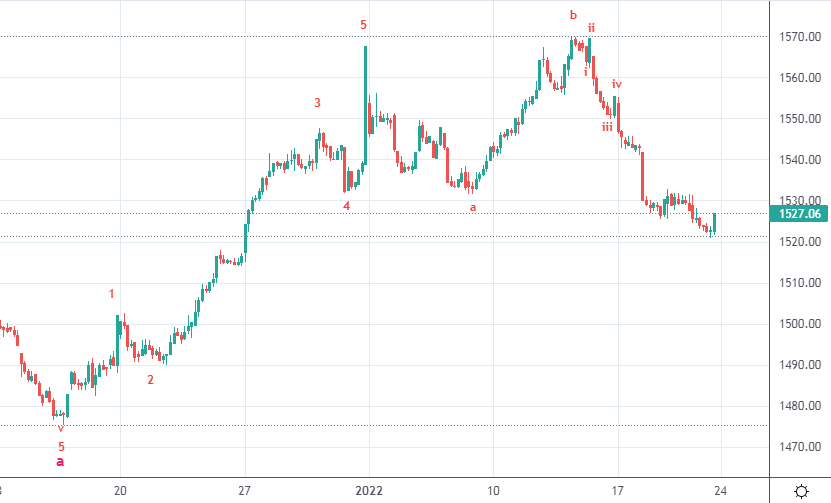
Daily Time Frame
To recap from session 93, assuming sub minuette wave b was ended at 1567.53, micro sub minuette a/b could has been formed as labelled and micro sub minuette c has just been started towards to the downside UNLESS waves structure changes which might initiate an extension upward movement for sub minuette wave b to end in between FIBO 61.8% to 100% (1560-1613).
{{{{{{{{{{{{{{{{{{{{{{{{{{{{{{{{{{{{{{{{{{{{{{{{{{{{
For the past one week, weak sentiment initiated selling pressure to the downside as expected and micro sub minuette c has been on its way to lower level. Currently, micro sub minuette i/ii/iii/iv has formed and micro sub minuette v extension could being formed. However, the wave structure will be monitored closely as the entire sub minuette wave c could be varied which would affect the target of wave E as labelled.
As usual, i am still leaving Wave Z alone since the assumption of new corrective wave above is still yet to be justified with wave E is still on the run towards the potential target of 1387 unless there is an new catalyst to drive KLCI to penetrate above revised ET1 or 1610 Convincingly for new wave structure.
}}}}}}}}}}}}}}}}}}}}}}}}}}}}}}}}}}}}}}}}}}}}}}}}}}}}
To reiterate, Wave Z could be formed in various correctives wave structure (Zig-Zag, Flat, Diagonal and etc) with momentum changes.
Since Multiple Complex Wave emerged, the new set of Higher Degree of 5 Waves Bull Run or Primary Wave 3 have yet to be seen until all corrective waves are served convincingly unless Wave X1 (1646.24) is penetrated. Thus, Higher Degree of Correction is still being prolong by these Multiple Complex Waves WXYXZ.
All waves' count and projected target are generated based on past/current price level and it may be subjected to vary if degree of momentum movement change.
Prevailing trend could be emerged if Daily levels listed below was broken:
Resistance -1608-1610, 1615, 1620, 1625-1628, 1639, 1645, 1650, 1662, 1679, 1685, 1700, 1720
Immediate resistance - 1531-33, 1542, 1549-50, 1556, 1559.66 (Upper Gap) 1566, 1570, 1573, 1581, 1590-1593, 1599-1602
Immediate Support - 1520-1522, 1515, 1510-1511, 1505
Support - 1500, 1495, 1490, 1484-1488, 1475, 1461-1466 , 1452, 1435
==================================================================================
Patient is required for the SUPER CYCLE Bull Run.
=================================================================================
Let's Mr Market pave the waves.
Trade safely
Wave Believer