Weekly Time Frame
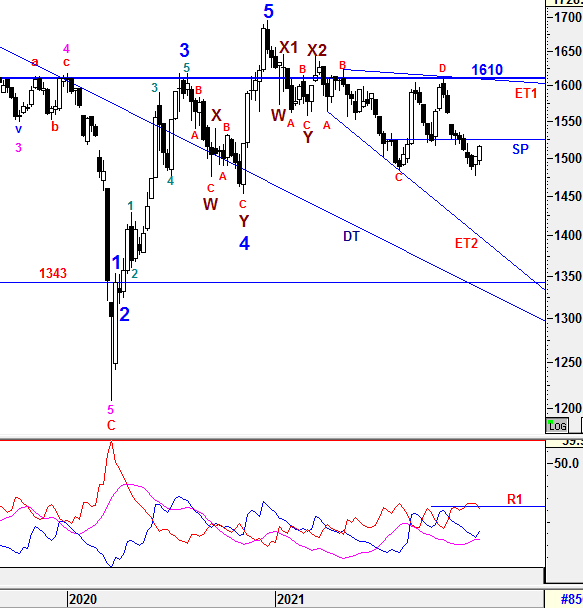
To recap from prior session 89, KLCI tried to breach the support range of 1484-1488 but was able to bounce off to close at 1502.01. There would be consolidation expected in coming weeks before clearer signal emerged.
{{{{{{{{{{{{{{{{{{{{{{{{{{{{{{{{{{{{{{{{{{{{{{{{{{{{
For the past one week, momentum has improved and KLCI has moved higher to close above the psychology level of 1500. However, the volume was significant low which indicated the strength of the upward momentum is not strong enough. Therefore, weekly SP line (1525) can be critical resistance to watch and penetration effect can initiate an follow through buying interest to the upside to test the Gap Resistance (1545.99-1559.66).
Let's check the temperature of the trend.
TREND indicators
1) -DMI (red line) is curving down with higher margin indicates bear strength is decreasing with higher pace and returned below R1 indicates bear is weakening.
2) +DMI (blue line) is curving up with higher margin indicates bull strength is increasing with higher pace.
3) ADX (pink line) continued heading up with lower margin implying that the volatility of the current trend is increasing with lower margin but still low and weak.
Therefore, the summations of the 3 signals above is still implying Bear strength is in favor. -DMI has crossed above +DMI for the eight weeks with -DMI is returning below R1 indicating the Bear strength is still strong but weakening. Besides that, ADX is showing sign of the volatility of current trend is getting slower and not firmed yet. Since Gap Down levels are still yet to be tested, I am still expecting KLCI to be consolidating in between revised ET1 and ET2 expanding triangle in Medium Term which bias to the downside as any rebound would not be as solid trend reversal. Therefore, caution is still required unless Gap (1545.99-1559.66) is able to be penetrated OR ET1 or 1610 could be penetrated to the upside CONVINCINGLY.
}}}}}}}}}}}}}}}}}}}}}}}}}}}}}}}}}}}}}}}}}}}}}}}}}}}}
From wave count perspective, the Higher Degree of Correction wave would be prolong with Multiple WXYXZ complex waves before a new set of Higher Degree of Bull Wave take place. Besides that, wave D has been justified to end at 1604.98 and wave E might be in its way to the downside. Therefore, Wave Z is still not been realized yet. Subsequent minor waves would be elaborated further in daily time frame.
Prevailing trend could be emerged if Weekly levels listed below was broken:
Resistance - 1610, 1615, 1619, 1627, 1633, 1642, 1650, 1700, 1720
Immediate Resistance - 1525, 1531, 1538, 1546-1560 (Gap), 1564, 1571, 1575, 1580, 1590, 1595, 1600
Immediate Support - 1515, 1505-1508, 1500, 1484-1488, 1474-1476, 1466
Support - 1452, 1447, 1436, 1407
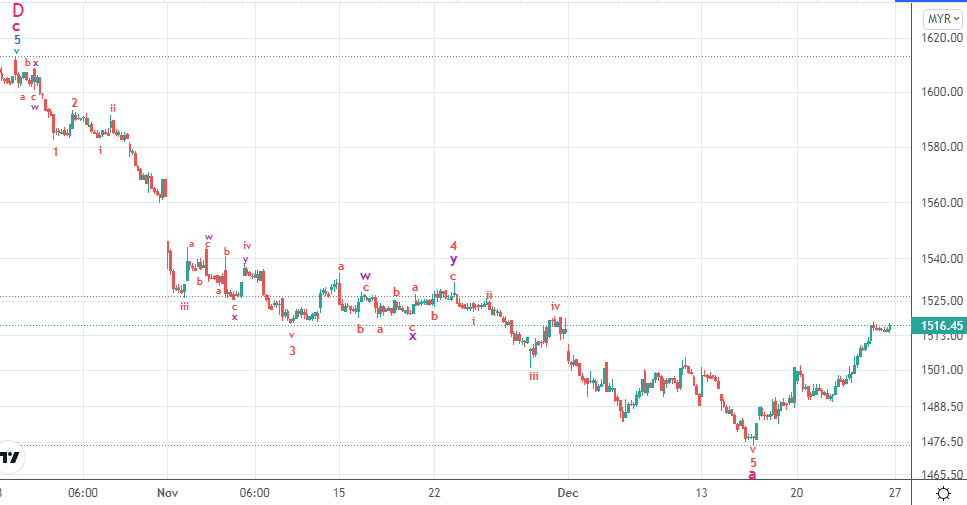
Daily Time Frame
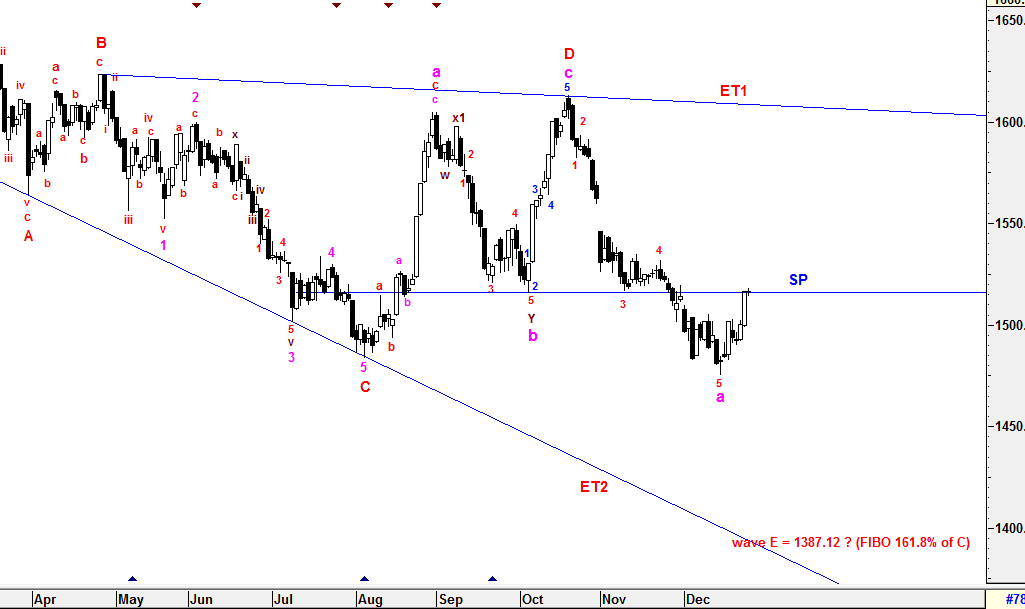
To recap from session 89, KLCI had made a low of 1475.37 which was 2 points away from one of the FIBO target 1473 as labelled. Besides that, micro sub minuette wave v had been extended to complete the micro cycle of micro sub minuette wave i-ii-iii-iv-v in conjunction with sub minuette wave 5 if sub minuette wave 5 assumed to end at 1475.37. However, i was still won't rule out that the extension waves could drive the index lower to meet one of the target as labelled if the selling pressure persisted.
{{{{{{{{{{{{{{{{{{{{{{{{{{{{{{{{{{{{{{{{{{{{{{{{{{{{
For the past one week, KLCI was able to move higher with low volume which indicated the current upward could be just an technical rebound without sufficient strength. Besides that, it has been resisted at daily SP line and assumed that there is no a solid trend reversal signal yet. In wave count perspective, micro sub minuette wave v was justified to end at 1475.37 in conjunction with sub minuette wave 5 of higher degree of sub minuette wave a as labelled. Since sub minuette wave a has been ended, the current upward movement could be the start of sub minuette wave b. If KLCI could penetrate above SP line, sub minuette wave b could end at 1528 (FIBO 38.2%) or the GAP resistance 1545.99 (Lower Gap) if the stronger momentum emerged.
As usual, i am still leaving Wave Z alone since the assumption of new corrective wave above is still yet to be justified with wave E is still in the run towards the potential target of 1387 unless there is an new catalyst to drive KLCI to penetrate above ET1 or 1610 Convincingly for new wave structure.
}}}}}}}}}}}}}}}}}}}}}}}}}}}}}}}}}}}}}}}}}}}}}}}}}}}}
To reiterate, Wave Z could be formed in various correctives wave structure (Zig-Zag, Flat, Diagonal and etc) with momentum changes.
Since Multiple Complex Wave emerged, the new set of Higher Degree of 5 Waves Bull Run or Primary Wave 3 have yet to be seen until all corrective waves are served convincingly unless Wave X1 (1646.24) is penetrated. Thus, Higher Degree of Correction is still being prolong by these Multiple Complex Waves WXYXZ.
All waves' count and projected target are generated based on past/current price level and it may be subjected to vary if degree of momentum movement change.
Prevailing trend could be emerged if Daily levels listed below was broken:
Resistance -1566, 1570, 1573, 1581, 1590-1593, 1599-1602, 1608-1610, 1615, 1620, 1625-1628, 1639, 1645, 1650, 1662, 1679, 1685, 1700, 1720
Immediate resistance - 1520-1522, 1531, 1537, 1543, 1545.99 (Lower Gap), 1556-1557, 1559.66 (Upper Gap)
Immediate Support - 1515, 1510-1511, 1505, 1500, 1495, 1490, 1484-1488, 1475, 1461-1466
Support - 1452, 1435
==================================================================================
Patient is required for the SUPER CYCLE Bull Run.
=================================================================================
Let's Mr Market pave the waves.
Trade safely
Wave Believer