Weekly Time Frame
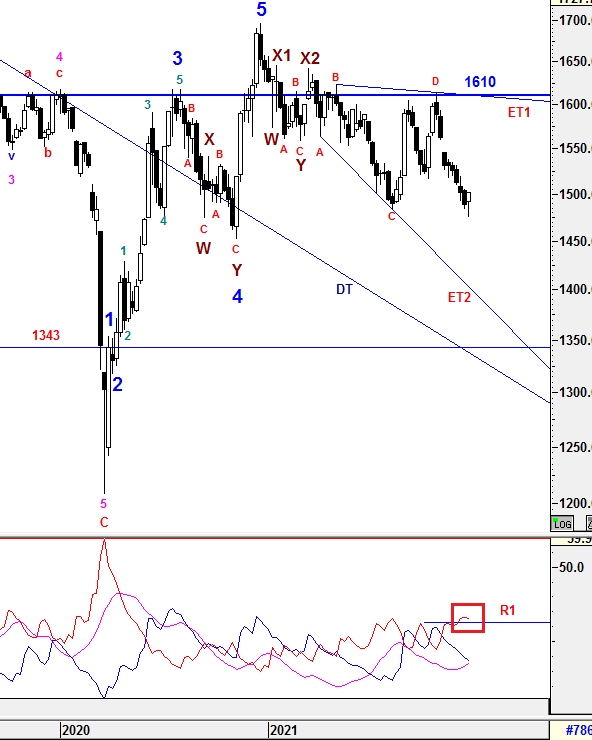
To recap from prior session 88,KLCI succumb another selling pressure to test lower level at the critical support of 1484 as expected. Currently, the index has been supported at the range of 1484-1488.
{{{{{{{{{{{{{{{{{{{{{{{{{{{{{{{{{{{{{{{{{{{{{{{{{{{{
The the past one week, KLCI tried to breach the support range of 1484-1488 but was able to bounce off to close at 1502.01. There would be consolidation expected in coming weeks before clearer signal emerged. Let's check the temperature of the trend.
TREND indicators
1) -DMI (red line) is flattening with lower margin indicates bear strength is decreasing with lower pace and still hovering above R1 indicates bear may continue.
2) +DMI (blue line) continued heading down with consistent margin indicates bull strength is decreasing with consistent pace.
3) ADX (pink line) continued heading up with consistent margin implying that the volatility of the current trend is increasing consistently but still low and weak.
Therefore, the summations of the 3 signals above is still implying Bear strength is in favor. -DMI has crossed above +DMI for the seventh week with -DMI is still staying above R1 indicating the Bear strength is still strong but flattening. Besides that, ADX is showing sign of the volatility of current trend is getting stronger but still weak and not firmed yet. Since Gap Down levels are still yet to be tested, I am still expecting KLCI to be consolidating in between revised ET1 and ET2 expanding triangle in Medium Term which bias to the downside as any rebound would not be as solid trend reversal. Therefore, caution is still required unless Gap (1545.99-1559.66) is able to be closed OR revised ET1 or 1610 could be penetrated to the upside CONVINCINGLY.
}}}}}}}}}}}}}}}}}}}}}}}}}}}}}}}}}}}}}}}}}}}}}}}}}}}}
From wave count perspective, the Higher Degree of Correction wave would be prolong with Multiple WXYXZ complex waves before a new set of Higher Degree of Bull Wave take place. Besides that, wave D has been justified to end at 1604.98 and wave E might be in its way to the downside. Therefore, Wave Z is still not been realized yet. Subsequent minor waves would be elaborated further in daily time frame.
Prevailing trend could be emerged if Weekly levels listed below was broken:
Resistance - 1633, 1642, 1650, 1700, 1720
Immediate Resistance - 1505, 1515, 1524, 1531, 1538, 1546-1560 (Gap), 1564, 1571, 1575, 1580, 1590, 1595, 1600, 1610, 1615, 1619, 1627
Immediate Support - 1500, 1484-1488, 1474-1476, 1466
Support - 1452, 1447, 1436, 1407
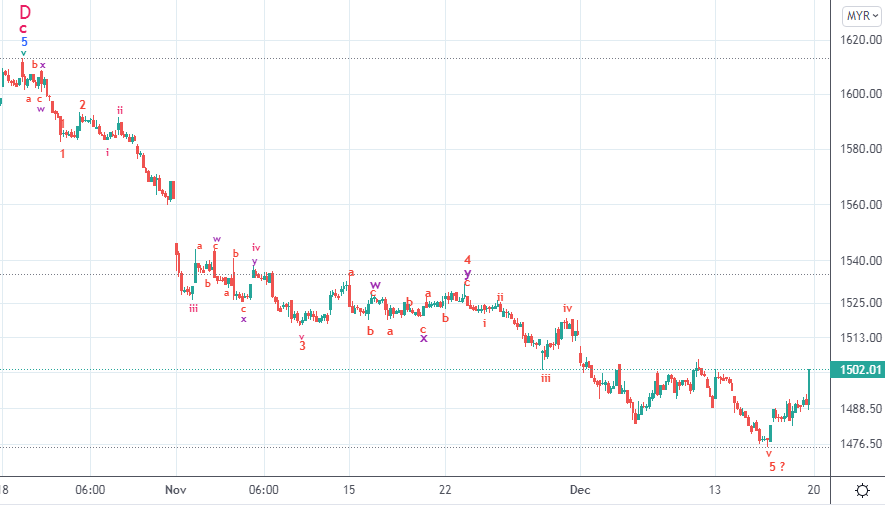
Daily Time Frame
To recap from session 88, sub minuette wave 5 had been extended to lower lever as expected and tested the support range of 1484-1488. Although the micro sub minuette wave i-ii-iii-iv-v (hourly time frame) were completed to fit the minimum criteria for ending sub minuette wave 5, i won't rule out that the extension waves could drive the index lower to meet one of the target as labelled in daily time frame.
{{{{{{{{{{{{{{{{{{{{{{{{{{{{{{{{{{{{{{{{{{{{{{{{{{{{
For the past one week, KLCI had made a low of 1475.37 which was 2 points away from one of the FIBO target 1473 as labelled. Besides that, micro sub minuette wave v has been extended to complete the micro cycle of micro sub minuette wave i-ii-iii-iv-v in conjunction with sub minuette wave 5 if sub minuette wave 5 assumed to end at 1475.37. However, i still won't rule out that the extension waves could drive the index lower to meet one of the target as labelled if the selling pressure persist.
As usual, i am still leaving Wave Z alone since the assumption of new corrective wave above is still yet to be justified with wave E is still in the run unless there is an new catalyst to drive KLCI to penetrate above ET1 or 1610 Convincingly for new wave structure.
}}}}}}}}}}}}}}}}}}}}}}}}}}}}}}}}}}}}}}}}}}}}}}}}}}}}
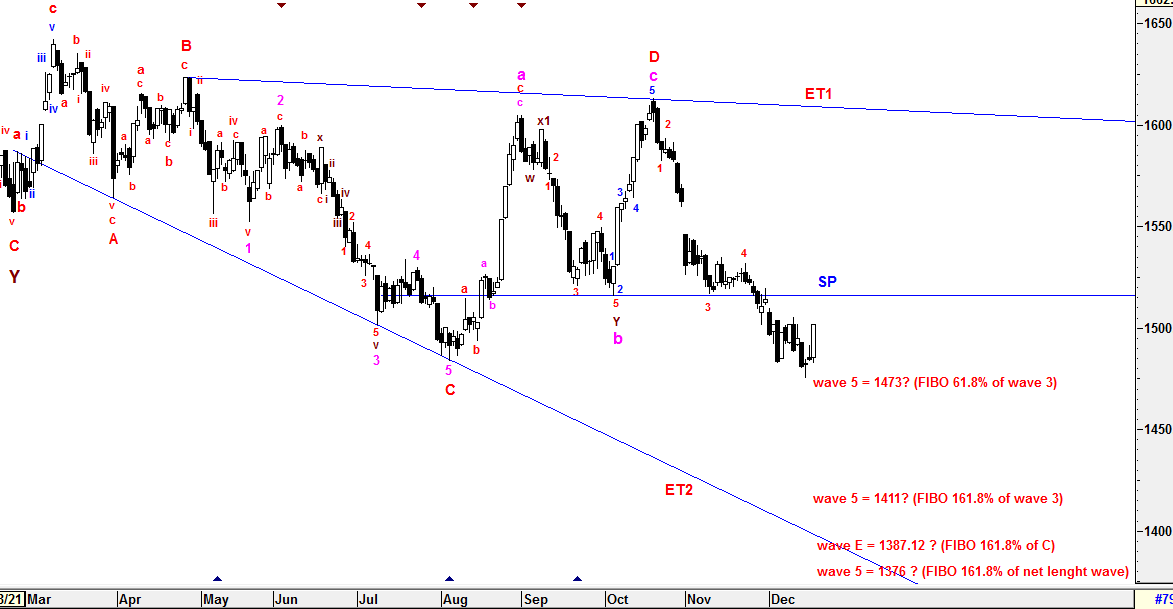
To reiterate, Wave Z could be formed in various correctives wave structure (Zig-Zag, Flat, Diagonal and etc) with momentum changes.
Since Multiple Complex Wave emerged, the new set of Higher Degree of 5 Waves Bull Run or Primary Wave 3 have yet to be seen until all corrective waves are served convincingly unless Wave X1 (1646.24) is penetrated. Thus, Higher Degree of Correction is still being prolong by these Multiple Complex Waves WXYXZ.
All waves' count and projected target are generated based on past/current price level and it may be subjected to vary if degree of momentum movement change.
Prevailing trend could be emerged if Daily levels listed below was broken:
Resistance -1566, 1570, 1573, 1581, 1590-1593, 1599-1602, 1608-1610, 1615, 1620, 1625-1628, 1639, 1645, 1650, 1662, 1679, 1685, 1700, 1720
Immediate resistance - 1505, 1510-1511, 1515, 1522-1518, 1531, 1537, 1543, 1545.99 (Lower Gap), 1556-1557, 1559.66 (Upper Gap)
Immediate Support - 1500, 1495, 1490, 1484-1488, 1475, 1461-1466
Support - 1452, 1435
==================================================================================
Patient is required for the SUPER CYCLE Bull Run.
=================================================================================
Let's Mr Market pave the waves.
Trade safely
Wave Believer