


Gamuda...Inverse Head And Shoulder Breakout
Gamuda...Inverse Head And Shoulder Breakout

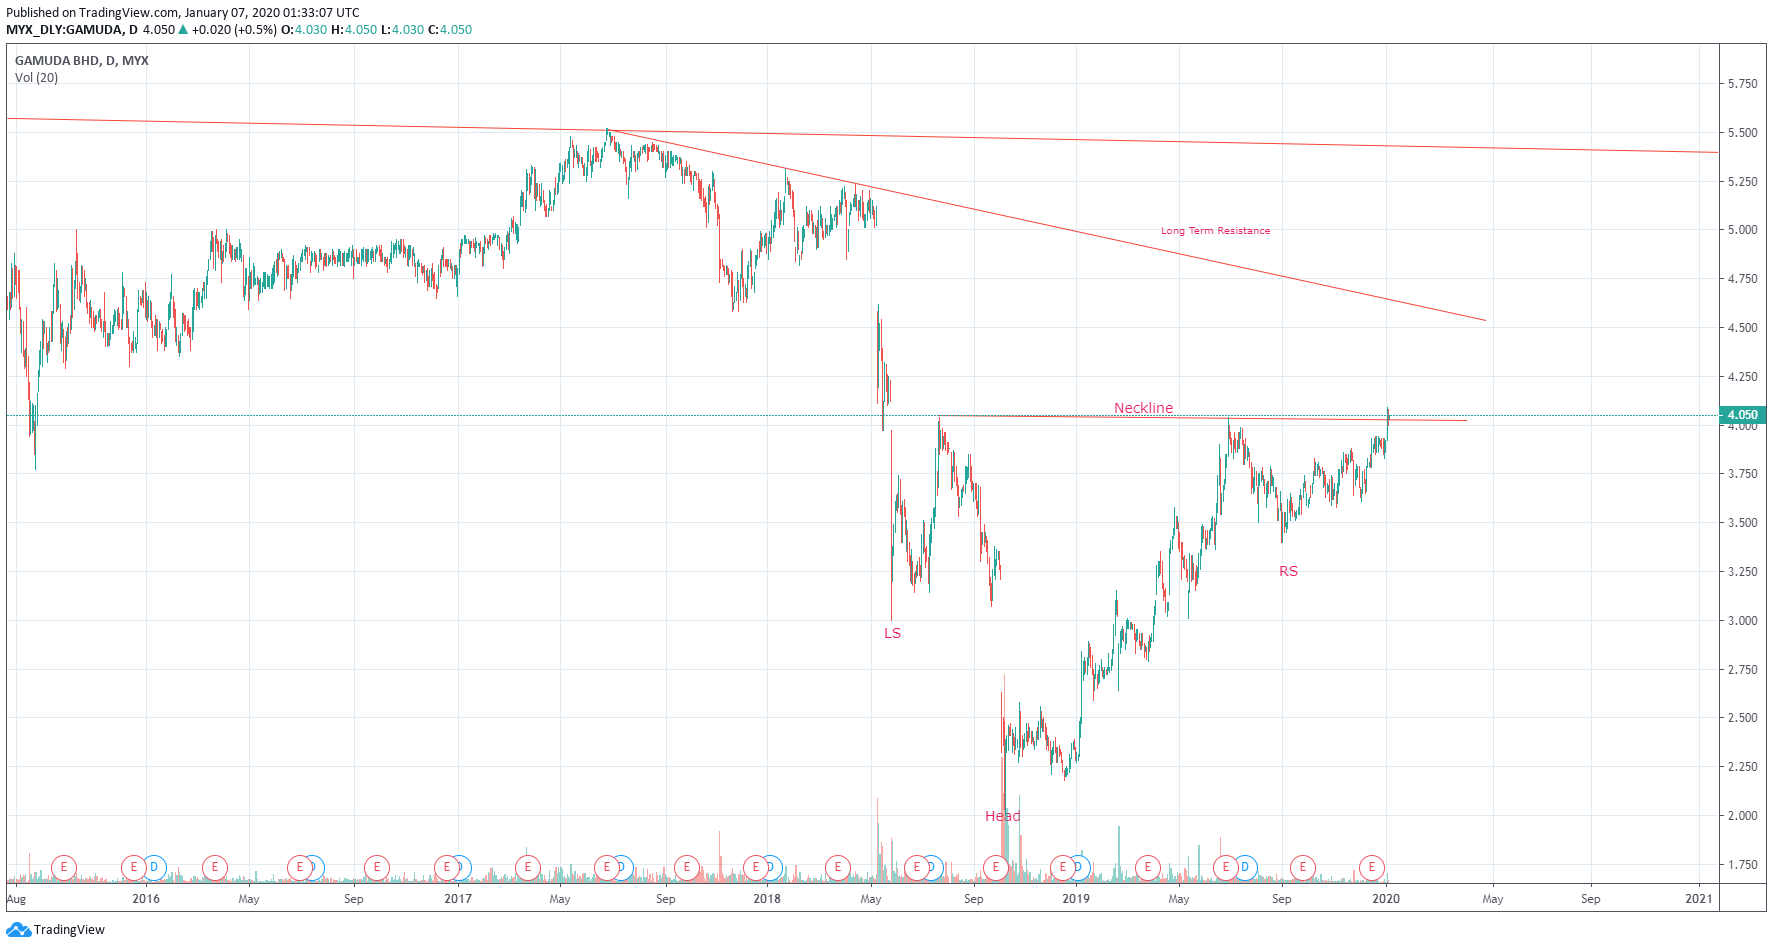
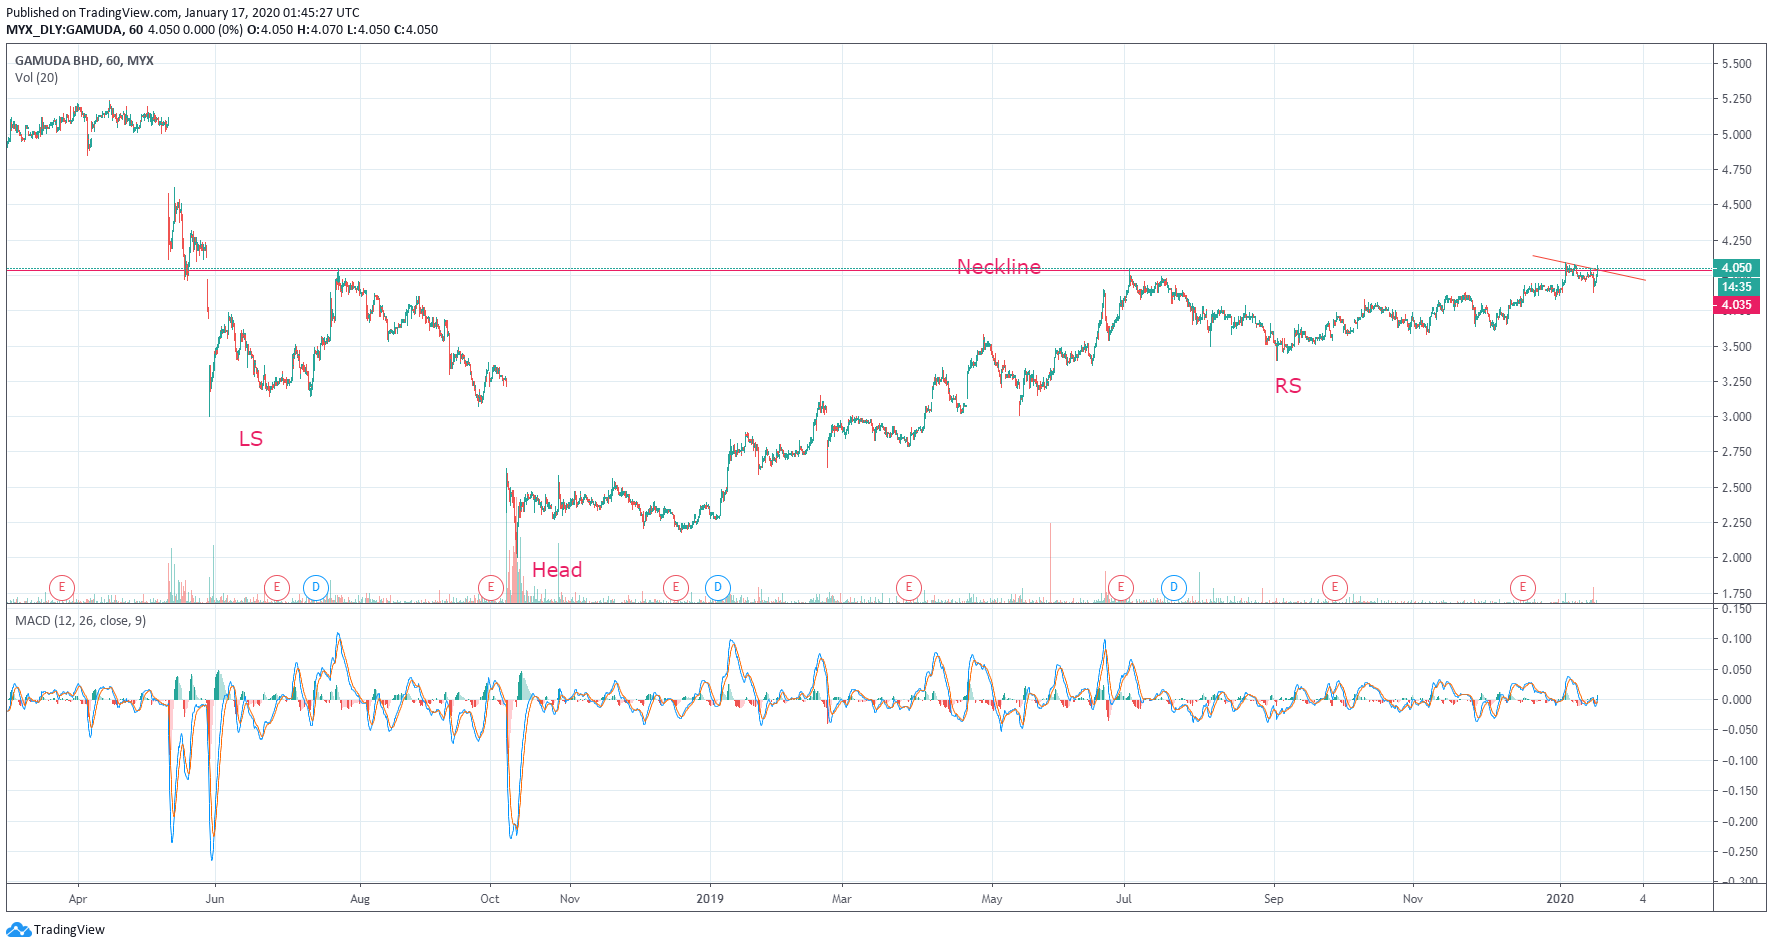
Gamuda, form a huge inverse head and shoulder with neckline at 4.04. The breakout was happened last week with price surge to hit 4.09 before pullback back hit the lowest of 3.88. Last two days the uptrend resume and breakout from the triangle this morning as seen in the following chart.
From the Inverse Head & Shoulder price target, the upside is around 6.
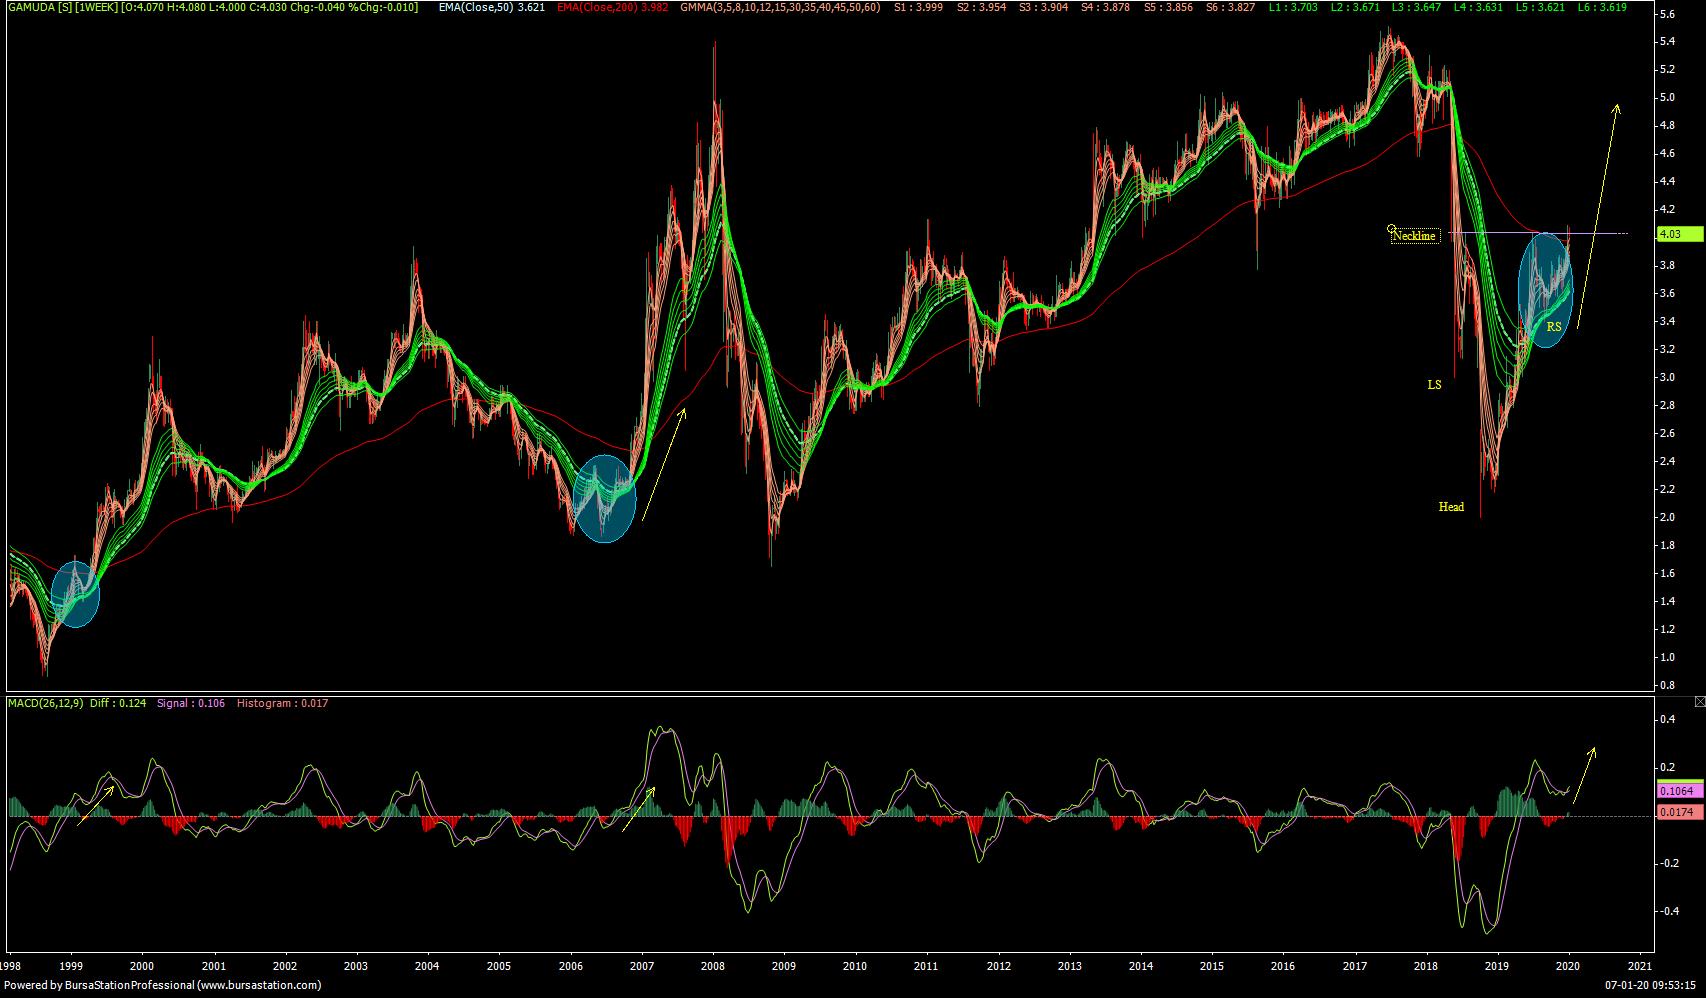
From the chart below, obviously Gamuda is on uptrend with new leg just began from 3.40. Current phase of uptrend will expect to be higher than 1st leg from 2-4.04...It can be seen from the weekly MACD (breakout from above zero line) and Guppy EMAs.(Golden Cross). If the history repeat again like what happen in mid 2006 and mid 2009, then current trend expect to be very powerful given that most of the mega infrastructure projects going to role out in 2020.
Discussions
Be the first to like this. Showing 0 of 0 comments
Post a Comment
Featured Posts
Introducing MY's First IPO Fund for Sophisticated Investors!
New Update. Discover investment communities that resonate with your ideas
M & A Value Partners IPO Equity Fund has been launched - Targeted 13% Return p.a
Latest Videos


Apps


Top Articles
2
3
Koon Yew Yin's Blog
4
5
BFM Podcast
6
7
BFM Podcast
8
Axcapital's investment blog
KAB - Executing its way to a record quarter. Could more Petronas contracts be coming?
#
Stock
Score
Daily Stocks
Stock Name
Last
Change
Volume
Stock Name
Last
Change
Volume
Stock Name
Last
Change
Volume
MQ Trading Signals
Stock
Time
Signal
Duration
Stock
Time
Signal
Duration
Featured Advertisers / Partners


Ride The Bull Short The Bear
CS Tan
4.9 / 5.0
This book is the result of the author's many years of experience and observation throughout his 26 years in the stockbroking industry. It was written for general public to learn to invest based on facts and not on fantasies or hearsay....