


KLSE Stocks Review
TAWIN (7097) The Story behind the Chart of TA WIN HOLDINGS BHD

ChartStory72
Publish date: Tue, 15 Jun 2021, 12:36 PM
ChartStory72
0 211
We post FREE chart reviews on KLSE daily Top Gainers and Most Actively Traded Counters. We are also giving out free reviews for our subs as well. Come join us on Telegram and PM us to learn more and request for the stocks you need reviewing for FREE.
Facebook : https://www.facebook.com/thechartstory
Telegram : https://t.me/thechartstory
Facebook : https://www.facebook.com/thechartstory
Telegram : https://t.me/thechartstory
Tawin 7097
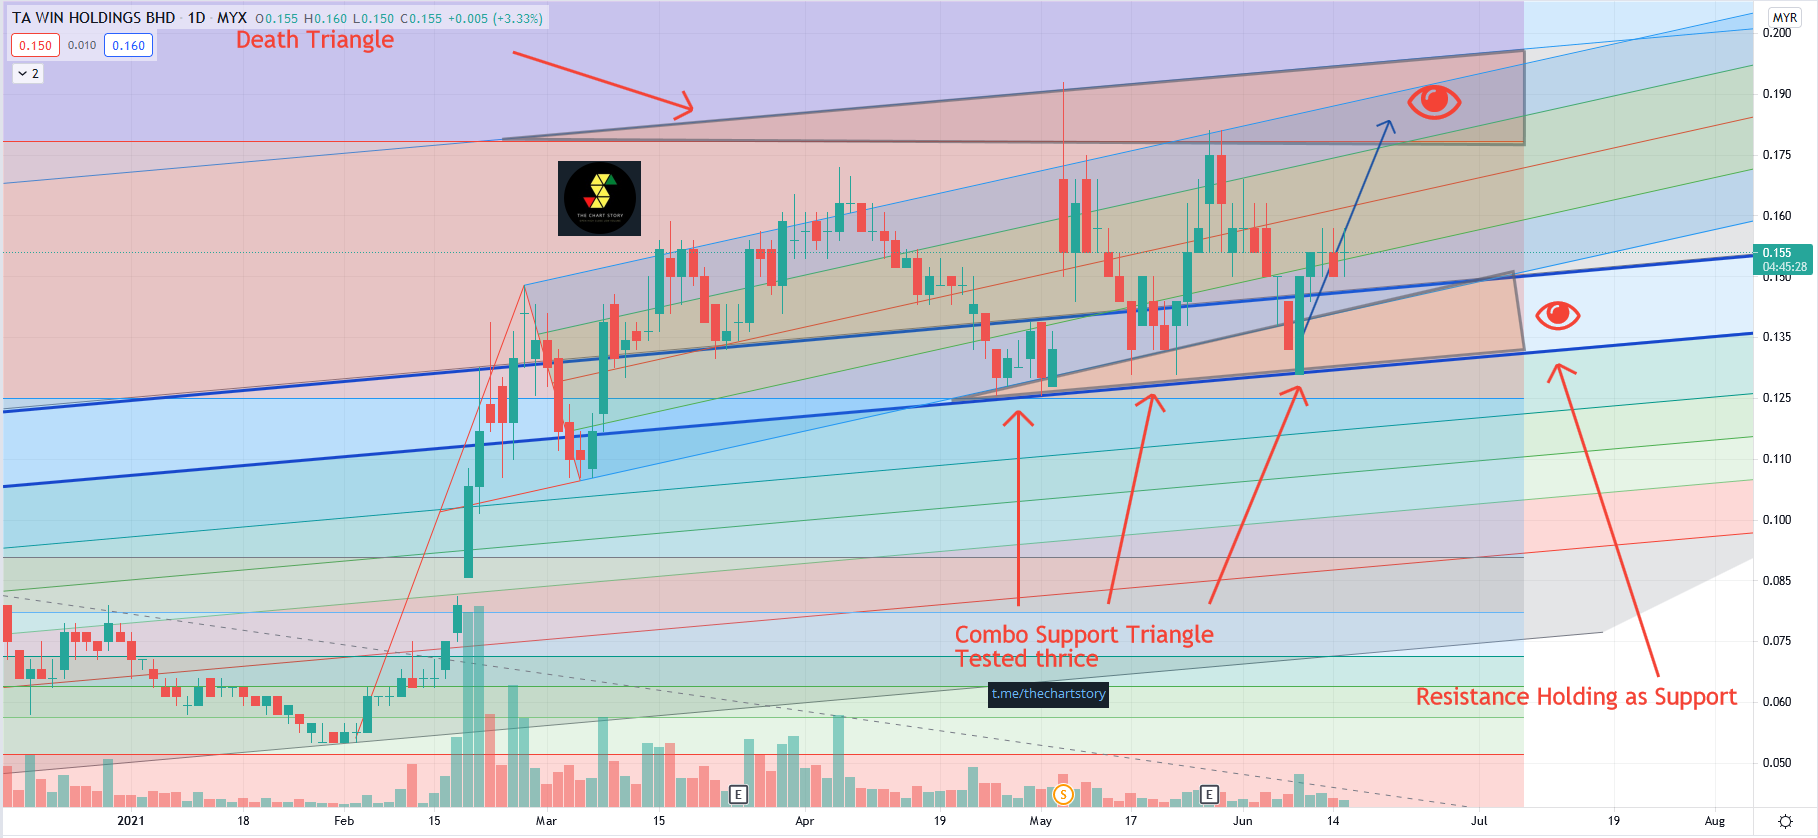
After the strong rally from previously, prices breakthrough the fibo resistance area level 1 and it went all the way up towards the Golden Ratio Resistance Area. To add a 2nd layer to it, that area is actually also the 2.618 of the Fibo Retracement, forming a Death Triangle Pattern. Where prices find it hard to breakthrough that Triangle.
Prices are now forming a small ranging mode between the fibo level 1.618 and 1. By adding a pitchfork into the picture, we can see that prices are actually forming a mini ranging uptrend pattern within the Pitchfork.
The next possible target would be back towards the Death Triangle Pattern. However, if prices are to break below the Combo Triangle Support, then all hope is lost.
Industry: Metals.
In this fast-moving digital world, we get information in a few clicks.
However, we rarely get first-hand information and more often we get misleading news.
Investing in stocks today is very different from the past, but one thing hasn't changed - to study about a stock before putting money in.
A stock chart contains data that is publicly available and accurate by itself. By having certainty in data quality, we can comfortably study charts and make investment judgements.
At Chart Story, we believe stock prices move for a reason. Our objective is to share what we believe.
More articles on KLSE Stocks Review
YTL (0025) The Story behind the Chart of YTL CORPORATION BERHAD
Created by ChartStory72 | May 05, 2022
DSONIC (5216) The Story behind the Chart of DATASONIC GROUP BERHAD
Created by ChartStory72 | Apr 18, 2022
FRONTKN (0128) The Story behind the Chart of FRONTKEN CORP BHD
Created by ChartStory72 | Jan 18, 2022
ANNJOO (6556) The Story behind the Chart of ANN JOO RESOURCES BHD
Created by ChartStory72 | Jan 17, 2022
EVERGRN (5101) The Story behind the Chart of EVERGREEN FIBREBOARD BERHAD
Created by ChartStory72 | Jan 11, 2022
TEXCYCL (0089) The Story behind the Chart of TEX CYCLE TECHNOLOGY (M) BERHAD
Created by ChartStory72 | Jan 10, 2022
Wong (7050) The Story behind the Chart of WONG ENGINEERING CORPORATION BERHAD
Created by ChartStory72 | Jan 03, 2022
TOPGLOV ( 7113) The Story behind the Chart of TOP GLOVE CORP BHD
Created by ChartStory72 | Dec 06, 2021
Discussions
Be the first to like this. Showing 0 of 0 comments
Post a Comment
Featured Posts
Introducing MY's First IPO Fund for Sophisticated Investors!
New Update. Discover investment communities that resonate with your ideas
M & A Value Partners IPO Equity Fund has been launched - Targeted 13% Return p.a
Latest Videos


Apps


Top Articles
1
4
5
Phillip Capital Research Reports
6
Good Articles to Share
7
Good Articles to Share
Putin orders Russian army to grow by 180,000 soldiers to become 1.5 million-strong
8
Good Articles to Share
India gets US$386b funding for renewables target; Reliance, Adani pledge commitments
#
Stock
Score
Daily Stocks
Stock Name
Last
Change
Volume
Stock Name
Last
Change
Volume
Stock Name
Last
Change
Volume
MQ Trading Signals
Stock
Time
Signal
Duration
Stock
Time
Signal
Duration
Featured Advertisers / Partners


Ride The Bull Short The Bear
CS Tan
4.9 / 5.0
This book is the result of the author's many years of experience and observation throughout his 26 years in the stockbroking industry. It was written for general public to learn to invest based on facts and not on fantasies or hearsay....