


KLSE Stocks Review
EURO (7208) The Story behind the Chart of EURO HOLDINGS BHD

ChartStory72
Publish date: Thu, 17 Jun 2021, 02:27 PM
ChartStory72
0 211
We post FREE chart reviews on KLSE daily Top Gainers and Most Actively Traded Counters. We are also giving out free reviews for our subs as well. Come join us on Telegram and PM us to learn more and request for the stocks you need reviewing for FREE.
Facebook : https://www.facebook.com/thechartstory
Telegram : https://t.me/thechartstory
Facebook : https://www.facebook.com/thechartstory
Telegram : https://t.me/thechartstory
Euro 7208
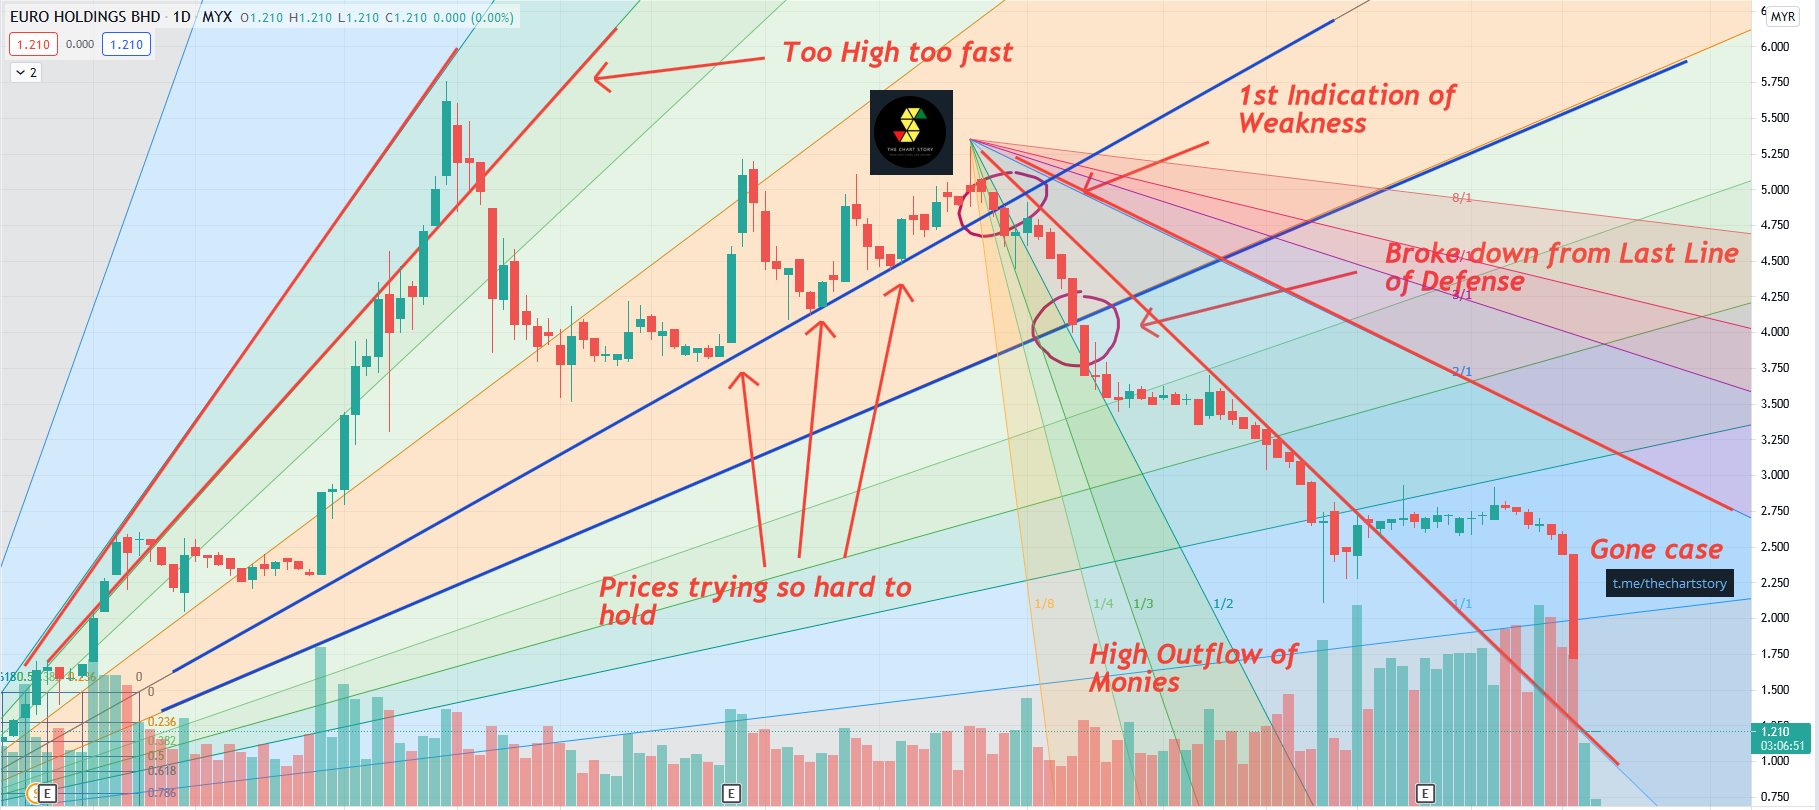
Sigh*. I hope none of you is holding this as it is really a lost cause. However, we can still learn a thing or two from the charts.
Firstly, notice how that uptrend is high and fast without any collection phase? I m not sure the reason behind the bankers pushing the prices so quickly. But the 1st bad sign appeared when prices enters the 0.618 Fibo zone too fast without any collection.
Secondly, we can see that prices tried hard to rebound at that support zone while prices continuously touching the zone within a short span of time, this indicates that the zone is weakening and eventually prices broke down from it.
Thirdly, the last line of defense breakdown. This indicates the uptrend had ended and prices could potentially range or downtrend. For this case downtrend.
By learning what is going on here, we now know that, whenever the same pattern occurs in the future for any other stocks, we know we should get out fast.
Industry: Consumer Services.
In this fast-moving digital world, we get information in a few clicks.
However, we rarely get first-hand information and more often we get misleading news.
Investing in stocks today is very different from the past, but one thing hasn't changed - to study about a stock before putting money in.
A stock chart contains data that is publicly available and accurate by itself. By having certainty in data quality, we can comfortably study charts and make investment judgements.
At Chart Story, we believe stock prices move for a reason. Our objective is to share what we believe.
More articles on KLSE Stocks Review
YTL (0025) The Story behind the Chart of YTL CORPORATION BERHAD
Created by ChartStory72 | May 05, 2022
DSONIC (5216) The Story behind the Chart of DATASONIC GROUP BERHAD
Created by ChartStory72 | Apr 18, 2022
FRONTKN (0128) The Story behind the Chart of FRONTKEN CORP BHD
Created by ChartStory72 | Jan 18, 2022
ANNJOO (6556) The Story behind the Chart of ANN JOO RESOURCES BHD
Created by ChartStory72 | Jan 17, 2022
EVERGRN (5101) The Story behind the Chart of EVERGREEN FIBREBOARD BERHAD
Created by ChartStory72 | Jan 11, 2022
TEXCYCL (0089) The Story behind the Chart of TEX CYCLE TECHNOLOGY (M) BERHAD
Created by ChartStory72 | Jan 10, 2022
Wong (7050) The Story behind the Chart of WONG ENGINEERING CORPORATION BERHAD
Created by ChartStory72 | Jan 03, 2022
TOPGLOV ( 7113) The Story behind the Chart of TOP GLOVE CORP BHD
Created by ChartStory72 | Dec 06, 2021
Discussions
Be the first to like this. Showing 0 of 0 comments
Post a Comment
Featured Posts


Latest Videos


Apps


Top Articles
1
4
5
Phillip Capital Research Reports
6
Good Articles to Share
7
Good Articles to Share
Putin orders Russian army to grow by 180,000 soldiers to become 1.5 million-strong
8
Good Articles to Share
India gets US$386b funding for renewables target; Reliance, Adani pledge commitments
#
Stock
Score
Daily Stocks
Stock Name
Last
Change
Volume
Stock Name
Last
Change
Volume
Stock Name
Last
Change
Volume
MQ Trading Signals
Stock
Time
Signal
Duration
Stock
Time
Signal
Duration
Featured Advertisers / Partners


Ride The Bull Short The Bear
CS Tan
4.9 / 5.0
This book is the result of the author's many years of experience and observation throughout his 26 years in the stockbroking industry. It was written for general public to learn to invest based on facts and not on fantasies or hearsay....