KLSE Stocks Review
KPOWER (7130) The Story behind the Chart of KUMPULAN POWERNET BHD
ChartStory72
Publish date: Mon, 21 Jun 2021, 12:48 PM

Kpower 7130
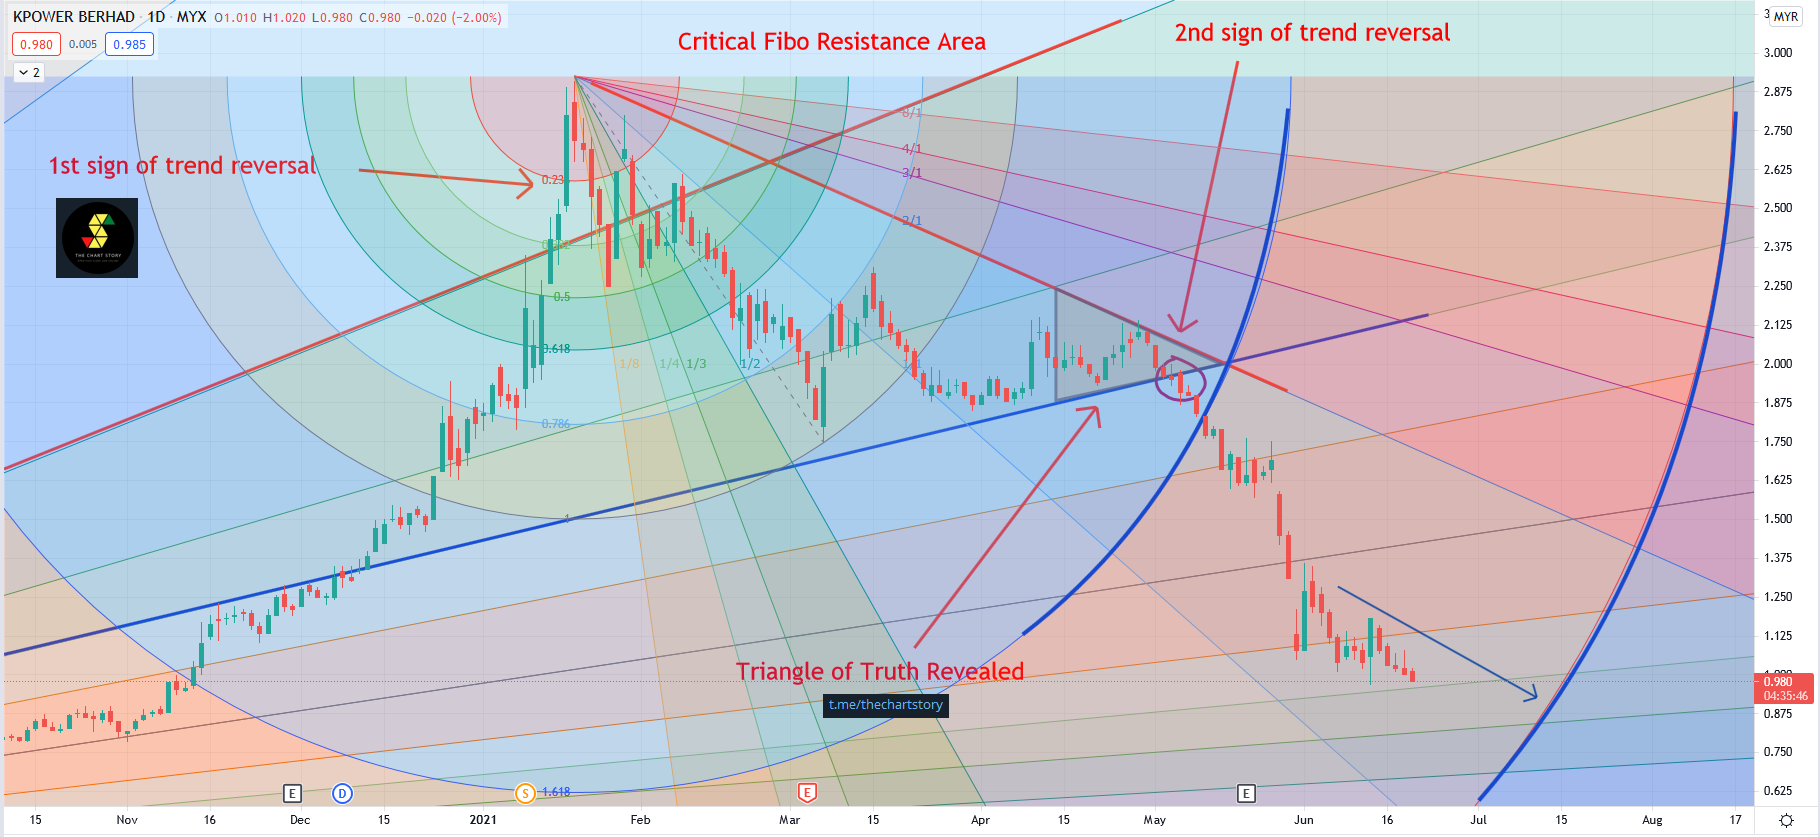
Previously prices are in a very strong uptrend, too strong that prices went into a dangerous zone, the 0.786 Fibo resistance zone. After that, prices could not stay inside the area and got rejected strongly back below the 0.786. That is the first sign of trouble as bankers had stopped their pushing.
Prices proceed to drop all the way towards the last line of defence and rebounded a few times, which at the same time forming the Triangle of Truth. The double break down from the Triangle of Truth + the Fibo Arc is the prove and the last confirmation that the bankers are done with this stock and they are cashing out big time, which also confirms the downtrend.
Prices should move towards the next Arc level slowly as there are only retailers left inside. Nothing to see for now.
Industry: Personal Goods.
In this fast-moving digital world, we get information in a few clicks.
However, we rarely get first-hand information and more often we get misleading news.
Investing in stocks today is very different from the past, but one thing hasn't changed - to study about a stock before putting money in.
A stock chart contains data that is publicly available and accurate by itself. By having certainty in data quality, we can comfortably study charts and make investment judgements.
At Chart Story, we believe stock prices move for a reason. Our objective is to share what we believe.
More articles on KLSE Stocks Review
YTL (0025) The Story behind the Chart of YTL CORPORATION BERHAD
Created by ChartStory72 | May 05, 2022
DSONIC (5216) The Story behind the Chart of DATASONIC GROUP BERHAD
Created by ChartStory72 | Apr 18, 2022
FRONTKN (0128) The Story behind the Chart of FRONTKEN CORP BHD
Created by ChartStory72 | Jan 18, 2022
ANNJOO (6556) The Story behind the Chart of ANN JOO RESOURCES BHD
Created by ChartStory72 | Jan 17, 2022
EVERGRN (5101) The Story behind the Chart of EVERGREEN FIBREBOARD BERHAD
Created by ChartStory72 | Jan 11, 2022
TEXCYCL (0089) The Story behind the Chart of TEX CYCLE TECHNOLOGY (M) BERHAD
Created by ChartStory72 | Jan 10, 2022
Wong (7050) The Story behind the Chart of WONG ENGINEERING CORPORATION BERHAD
Created by ChartStory72 | Jan 03, 2022
TOPGLOV ( 7113) The Story behind the Chart of TOP GLOVE CORP BHD
Created by ChartStory72 | Dec 06, 2021
Discussions
Be the first to like this. Showing 0 of 0 comments


