


MRCB stock analysis
Ahza Adhwa's August T.A 2018 for MRCB

Ahza Adhwa Zulkepli
Publish date: Fri, 24 Aug 2018, 04:10 PM
Yes, if you hold MRCB it is advisable for you to sell now. Why? (Please read and watch the chart)
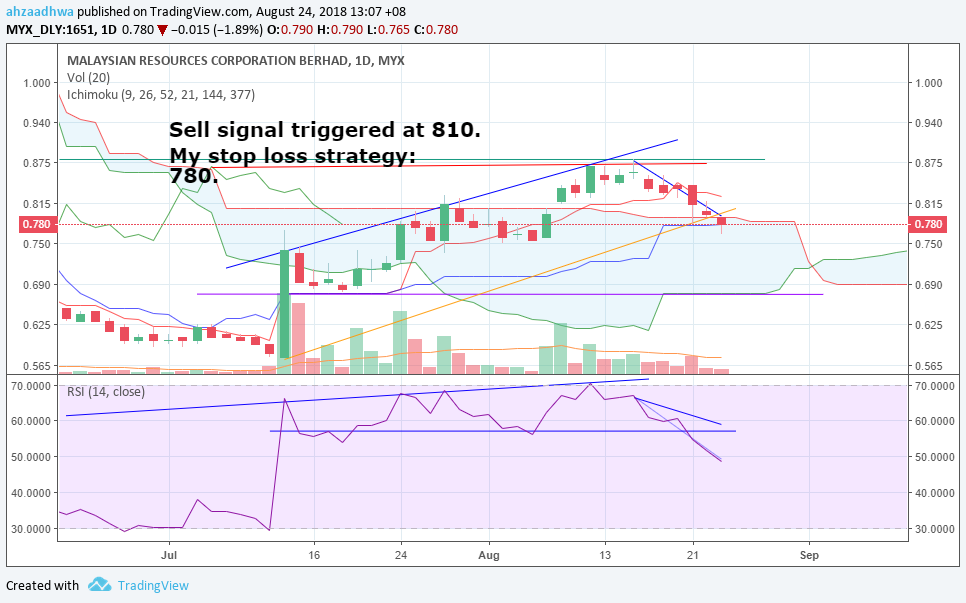
1. I plot a trend line based on resistance range of 740, 810 and 870. This trend line is based on the assumption that MRCB is trading at a bearish position.
2. Next, I plot a trend line based on support range of 570, 780 and 790. This trend line is based on the assumption that MRCB is trading at a bullish position.
3. We see a clear break of plotted bullish support has happened today (orange). MRCB has gone to 765 before bumping to 780. Even if it manages to hold 780 until the end of the day, it's a clear selling signal and we need to wait what will happen next. This is however, a different story if MRCB can skyrocket within its bullish range of any price higher than 800 (plotted bullish trend support). Which is not possible unless there's institution pumping it or there is a very good news coming out this afternoon.
4. Using only chart and volume might not be enough. Hence, I used RSI oscilator to justify my selling signal today.
5. I plotted a resistance on RSI based on the range of 65, 67 and 69. Its lower trend line is plotted based on RSI perpendicular line of 90 degree of early candle (the large green on 12th July) which then meet its 'determiner' point of 57, where it hits three times on 17th July, 6th August and 21st August. Any momentum lower than this should be a sell signal.
6. Move your cursor on the 21th August RSI, and you will get a losing momentum on that given date. Therefore an estimated sell signal has triggered on 810.
7. However, I made a stop loss of 780 assuming that the market need to 'breath'. It is however, failed to hold 780 today, and meet its lowest negative sentiment for a period of two weeks, with a testing price point of 765.
8. I've made a stop loss today on 780 which is then supported by:
a) The negative sentiments on domestic construction sector made by Malaysian Prime Minister.
b) The negative sentiments on international politics, with trade tension has no signs of easing.
9. Assuming that quarter report is positive next week, the price should hovering at 790 - 850. Bullish signal is triggered when research bank releases a price target for MRCB regaining confidence on the MRCB equity towards its RM 1 and above.
10. But if it turns out negative, then cross your finger folks. The road is long ahead.
11. Despite this recent update, I am still predicting that MRCB quarter report will be positive based on the increased bookings in various property projects of MRCB on Kuala Lumpur and Melbourne, Australia. But, until the time came, it is good idea to stick to my planned trading strategy.
12. See you next week pals. After the QR.
Related Stocks
| Chart | Stock Name | Last | Change | Volume |
|---|
More articles on MRCB stock analysis
Featured Posts
Introducing MY's First IPO Fund for Sophisticated Investors!
New Update. Discover investment communities that resonate with your ideas
M & A Value Partners IPO Equity Fund has been launched - Targeted 13% Return p.a
Latest Videos


MQ Trading Signals
Time
Signal
Duration
Type
2024-07-17 14:30:00
TURTLE SYSTEM 20
30 Mins
BUY
2024-07-17 14:30:00
TURTLE SYSTEM 55
30 Mins
BUY
2024-07-17 11:50:00
ADX
5 Mins
SELL
2024-07-17 10:05:00
TURTLE SYSTEM 20
5 Mins
BUY
2024-07-17 10:05:00
TURTLE SYSTEM 55
5 Mins
BUY
Apps


Top Articles
1
南洋行家论股
3
The Alpha Trader
4
BreakingOut
5
Koon Yew Yin's Blog
6
Bursa Stock Musings - Thoughts & Ideas
PGF Capital - insti shareholding up from 5% to 14%! (part 1)
7
南洋行家论股
8
RHB Investment Research Reports
#
Stock
Score
Daily Stocks
Stock Name
Last
Change
Volume
Stock Name
Last
Change
Volume
Stock Name
Last
Change
Volume
Featured Advertisers / Partners


Ride The Bull Short The Bear
CS Tan
4.9 / 5.0
This book is the result of the author's many years of experience and observation throughout his 26 years in the stockbroking industry. It was written for general public to learn to invest based on facts and not on fantasies or hearsay....
einstein6
I purchased some at 0.765 using contra today. So you are suggesting to sell it now, or since there is only few more days for QR, hold it until T3?
2018-08-24 17:16