M+ Online Technical Focus - 31 May 2017
MalaccaSecurities
Publish date: Wed, 31 May 2017, 10:17 AM

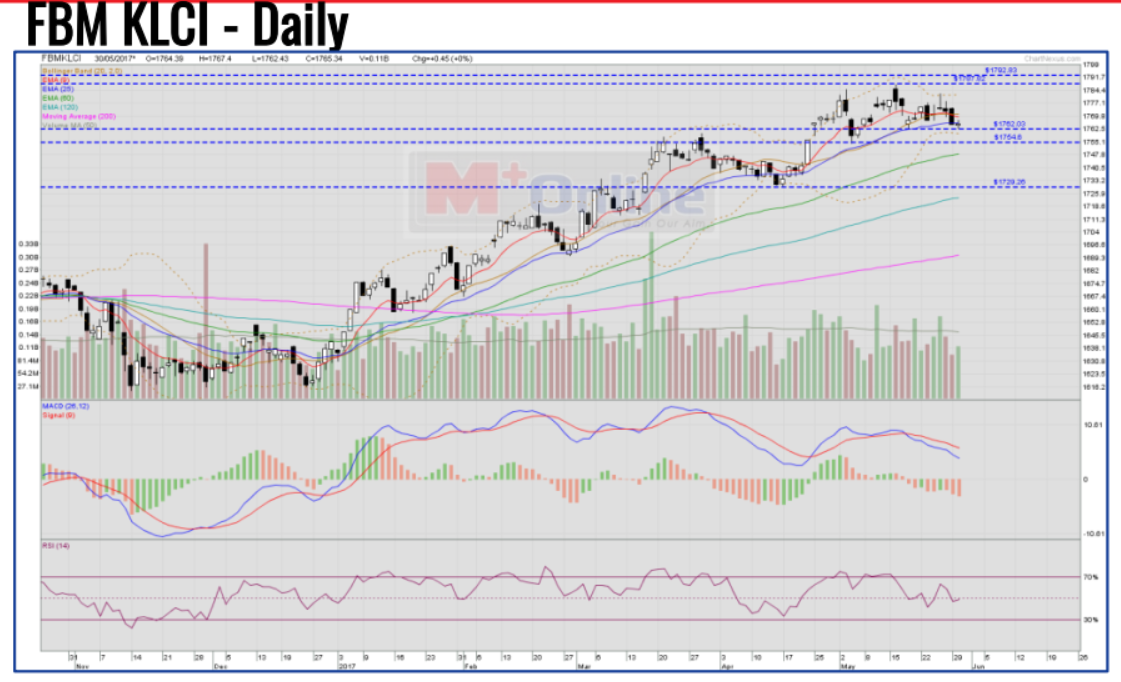
The FBM KLCI is hovering below the Bollinger Band's middle band (around 1,771) and even below the EMA9 (around 1,769) to hit intraday low at 1,962 before closing at 1,765.34 (+0.45, +0%). The MACD histogram extended another red bar below the zero level and the MACD line still stays below the signal line. The RSI is hovering slightly below the 50 level. The next immediate support levels are monitored around 1,762, 1,754 and more critically at 1,729, while the resistance levels are pegged near 1,787 and 1,792.

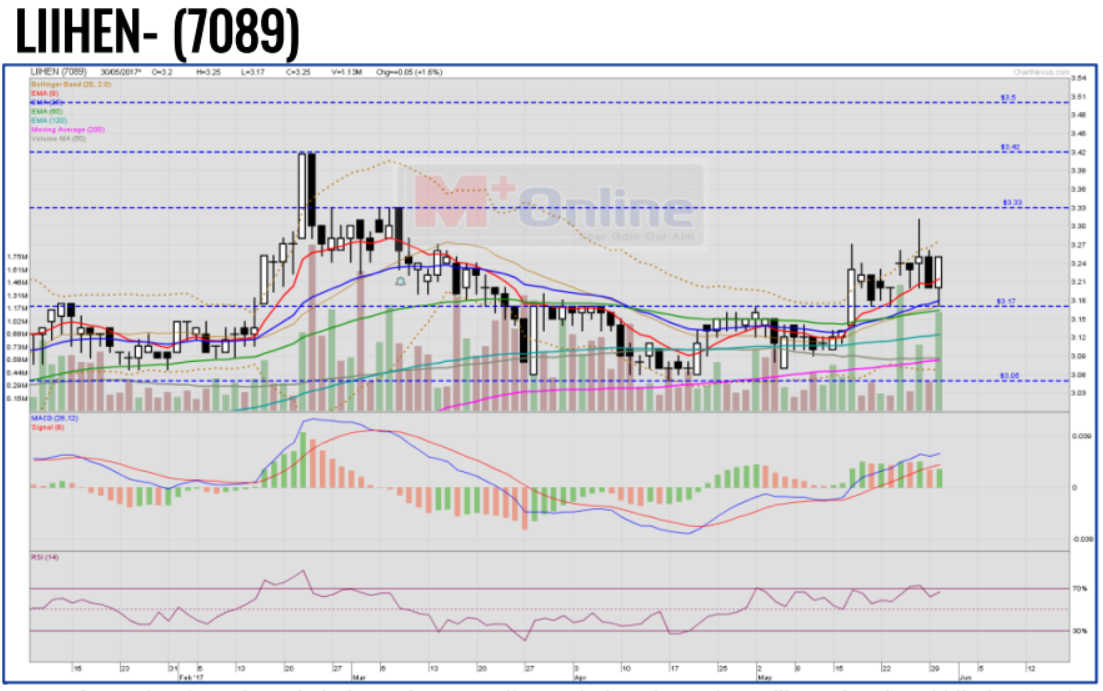
LIIHEN's stock price rebounded above the EMA9 line and also above the Bollinger band's middle band. The MACD histogram turned from a red bar to green bar, while the RSI is hovering above 65 toward the 70 level. Monitor for the price to breakout and stay above RM3.26 to envisage a move toward RM3.33 and RM3.42 respectively. Trailing stop with daily EMA9 or new entry stop loss below RM3.17.

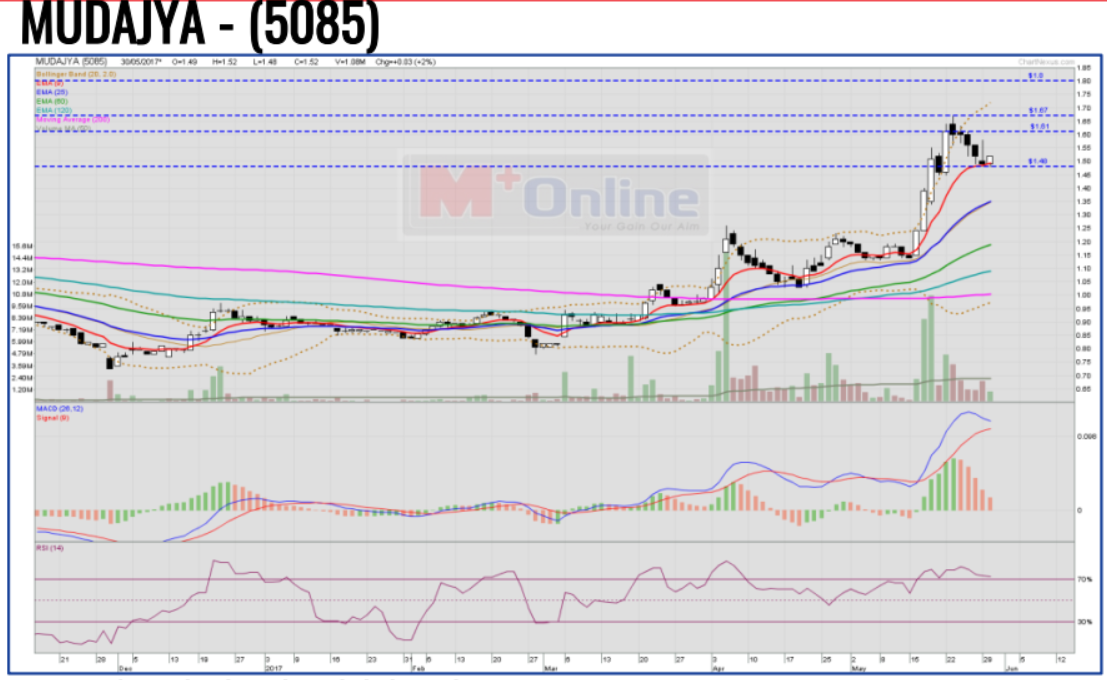
MUDAJYA's stock price rebounded above the EMA9. The MACD histogram extends another red bar, but the MACD line is still above signal line. The RSI is still hovering above the 70 level. Monitor for the price to break up and stay above RM1.52 to envisage a move toward RM1.61 and RM1.67. Trailing stop with daily EMA9 or new entry stop loss below RM1.48.

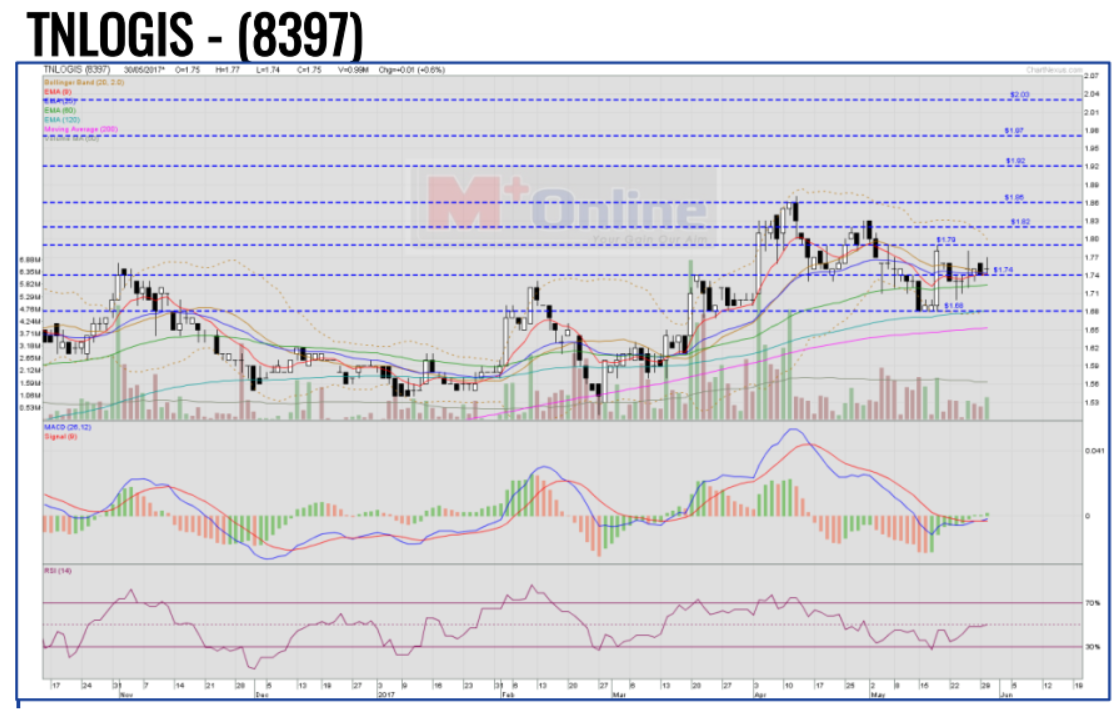
TNLOGIS's stock price is hovering just right above the Bollinger Band's middle band. The MACD histogram extended another green bar above the zero level and the MACD line is hovering above the signal line. The RSI is crossing above the 50 level. Monitor for the price to breakout above RM1.77 toward the next targets of RM1.86, and RM1.92. Trailing stop loss with the daily EMA9 line or new entry stop loss below RM1.74.
Source: Mplus Research - 31 May 2017
Related Stocks
| Chart | Stock Name | Last | Change | Volume |
|---|
More articles on M+ Online Research Articles
Created by MalaccaSecurities | Nov 15, 2024


