


The Stock Library
KLSE CHART ANALYSIS FBMKLCI 14 December 2012

Edwin Toh
Publish date: Sun, 16 Dec 2012, 11:37 AM
Edwin Toh
0 184
Talk about everything all under one roof which help us profit big money!! This blog have Technical Analyze Chart on Selected Stock and Forum for Daily Buy and Sell Call.
Disclaimer
All observation, buy call and sell call based on my own personal view are just for informational purpose and for my personal references to remind my self what i have analyze before and now for self improvement. Buy at your own risk and do not follow my view as i am only a novice analyzer with 60% success only..
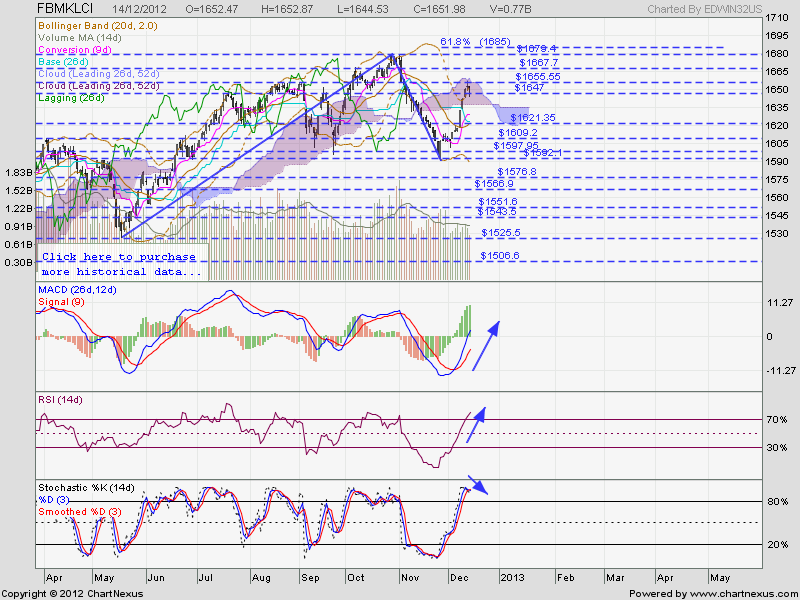
KLSE incline quickly after break above the resistance at 1621 and also broke above 1649 but facing some resistance at the 1655 resistance and Ichimoku Cloud Resistance..

ndicators
ndicators
1 ) Trendline - Uptrend
2) Support/Resistance - Formed lower low ( Bearish )
2) Support/Resistance - Formed lower low ( Bearish )
3) MACD -Bullish Crossover ( Bullish)
4) RSI - Broke above 70% (Bullish) ,
4) RSI - Broke above 70% (Bullish) ,
5) STO - Bearish crossover (
Bearish )
6) Ichimoku - a) Price coming entering from the resistance cloud and testing the upper resistance( Bullish ).
6) Ichimoku - a) Price coming entering from the resistance cloud and testing the upper resistance( Bullish ).
b) Conversion line above the base line (
Bullish ).
c) Price close above the baseline ( Bullish ) .
c) Price close above the baseline ( Bullish ) .
7) Candlestick - Hanging man (
Bearish ) Please refer here for more information
Conclusion:
Bullish
If it is able to break the Ichimoku cloud it will indicate stronger bullish sentiment but if it retrace back from now it may test back the support cloud at 1637.
Resistance- 1655/ 1668 /1681 /1725
Support - 1649 / 1621 /1600 / 1594 / 1581
More articles on The Stock Library
Featured Posts
New Update. Discover investment communities that resonate with your ideas

Apps


Top Articles
2
3
save malaysia!
4
5
6
TA Sector Research
BWYS Group Berhad - A Leading Sheet Metal and Scaffoldings Manufacturer
7
MQ Market Updates
8
TA Sector Research
#
Stock
Score
Daily Stocks
Stock Name
Last
Change
Volume
Stock Name
Last
Change
Volume
Stock Name
Last
Change
Volume
MQ Trading Signals
Stock
Time
Signal
Duration
Stock
Time
Signal
Duration
Featured Advertisers / Partners


Ride The Bull Short The Bear
CS Tan
4.9 / 5.0
This book is the result of the author's many years of experience and observation throughout his 26 years in the stockbroking industry. It was written for general public to learn to invest based on facts and not on fantasies or hearsay....