


UOB Kay Hian Research Articles
Traders' Corner - Telekom Malaysia (T MK)

UOBKayHian
Publish date: Mon, 16 Jul 2018, 10:24 AM
UOBKayHian
0 1,987
An official blog in I3investor to publish research reports provided by UOB Kay Hian research team.
All materials published here are prepared by UOB Kay Hian. For latest offers on UOB Kay Hian trading products and news, please refer to: http://www.utrade.com.my
UOB Kay Hian Securities (M) Sdn Bhd (194990-K)
Hotline:
1800 UTRADE /
1800 88 7233 (Securities)
+6088 235611 (Futures)
Email: contact@utrade.com.my
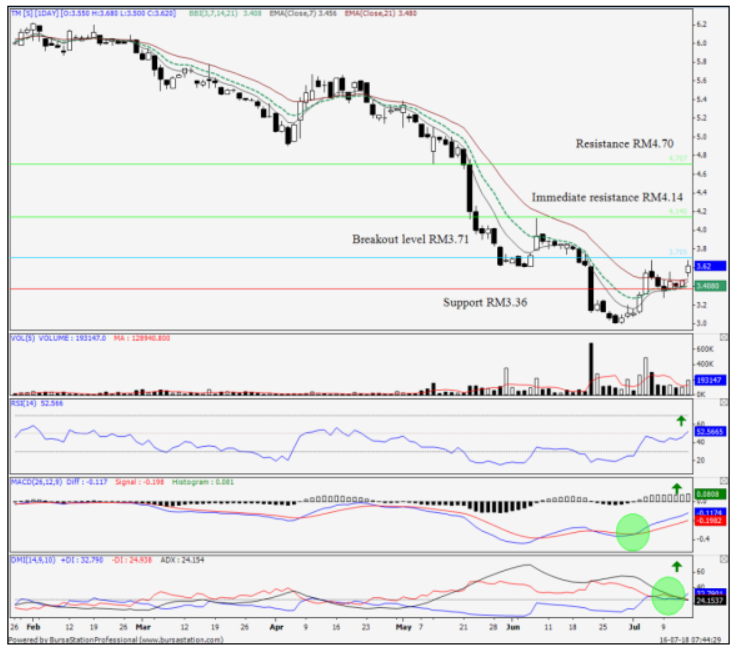
- Technical BUY on breakout with +26.4% potential return
- Last price: RM3.62
- Target price: RM4.13, RM4.69
- Support: RM3.36
- Stop-loss: RM3.34
BUY with a target price of RM4.69 and stoploss at RM3.34. Based on the daily chart, T has formed a series of higher highs and higher lows that indicates the uptrend pattern. This is supported by the 7-day EMA crossing above the 21-day EMA, which indicates a bullish signal. This is also consistent with the uptick in the RSI, which suggests stronger buying momentum ahead. Additionally, the bullish crossover in +DI and ADX line suggests strong upward movements. We peg our targets at RM4.13 and RM4.69 once it manages to penetrate the breakout level of RM3.71.
Expected Timeframe: 2 weeks to 2 months
Source: UOB Kay Hian Research - 16 Jul 2018
Related Stocks
| Chart | Stock Name | Last | Change | Volume |
|---|
Market Buzz
2024-05-08
TM2024-05-08
TM2024-05-08
TM2024-05-08
TM2024-05-08
TM2024-05-08
TM2024-05-08
TM2024-05-08
TM2024-05-08
TM2024-05-07
TM2024-05-07
TM2024-05-07
TM2024-05-07
TM2024-05-07
TM2024-05-06
TM2024-05-06
TM2024-05-06
TM2024-05-06
TM2024-05-06
TM2024-05-06
TM2024-05-06
TM2024-05-06
TM2024-05-03
TM2024-05-03
TM2024-05-03
TM2024-05-03
TM2024-05-03
TM2024-05-03
TMMore articles on UOB Kay Hian Research Articles
IHH Healthcare - 2Q22 Blip as Admissions See An Unequal Recovery
Created by UOBKayHian | Aug 26, 2022
IHH Healthcare - 4Q21 Results Beat Expectations Off Sustained Key Contributions
Created by UOBKayHian | Feb 24, 2022
Top Glove - 1QFY22 Results Weighed by Softened Industry Prospects
Created by UOBKayHian | Dec 13, 2021
Gloves Companies – Malaysia - Glove Manufacturers Deemed Non-Essential Under EMCO
Created by UOBKayHian | Jul 12, 2021
Rubber Gloves – Malaysia - New Coronavirus Sparks Loftier But Justified Valuations
Created by UOBKayHian | Jan 29, 2020
Featured Posts
Get Your NVDA Share by Opening a Moomoo Account*!

MQ Trading Signals
Time
Signal
Duration
Type
2024-05-08 15:20:00
ADX
5 Mins
SELL
2024-05-08 15:00:00
TURTLE SYSTEM 20
Hourly
SELL
2024-05-08 15:00:00
TURTLE SYSTEM 55
Hourly
SELL
2024-05-08 15:00:00
ADX
Hourly
SELL
2024-05-08 12:00:00
ADX
10 Mins
SELL
Apps


Top Articles
1
Follow Kim's Stockwatch!
THIS STOCK READY TO SKYROCKET!!! - THE POWER & WATER SUPPLY SERVICES
2
3
Follow Kim's Stockwatch!
THIS ANOTHER GEMS READY TO SKYROCKET!!! - MAJOR DEVELOPER IN PENANG
4
Mercury Securities Research
5
Koon Yew Yin's Blog
Eversendai Corporation made a remarkable comeback in FY2023 - Koon Yew Yin
6
AmInvest Research Reports
TRANSPORTATION & LOGISTICS - Our View on of Air Asia’s Restructuring
7
save malaysia!
8
BFM Podcast
#
Stock
Score
Daily Stocks
Stock Name
Last
Change
Volume
Stock Name
Last
Change
Volume
Stock Name
Last
Change
Volume
Featured Advertisers / Partners


Ride The Bull Short The Bear
CS Tan
4.9 / 5.0
This book is the result of the author's many years of experience and observation throughout his 26 years in the stockbroking industry. It was written for general public to learn to invest based on facts and not on fantasies or hearsay....