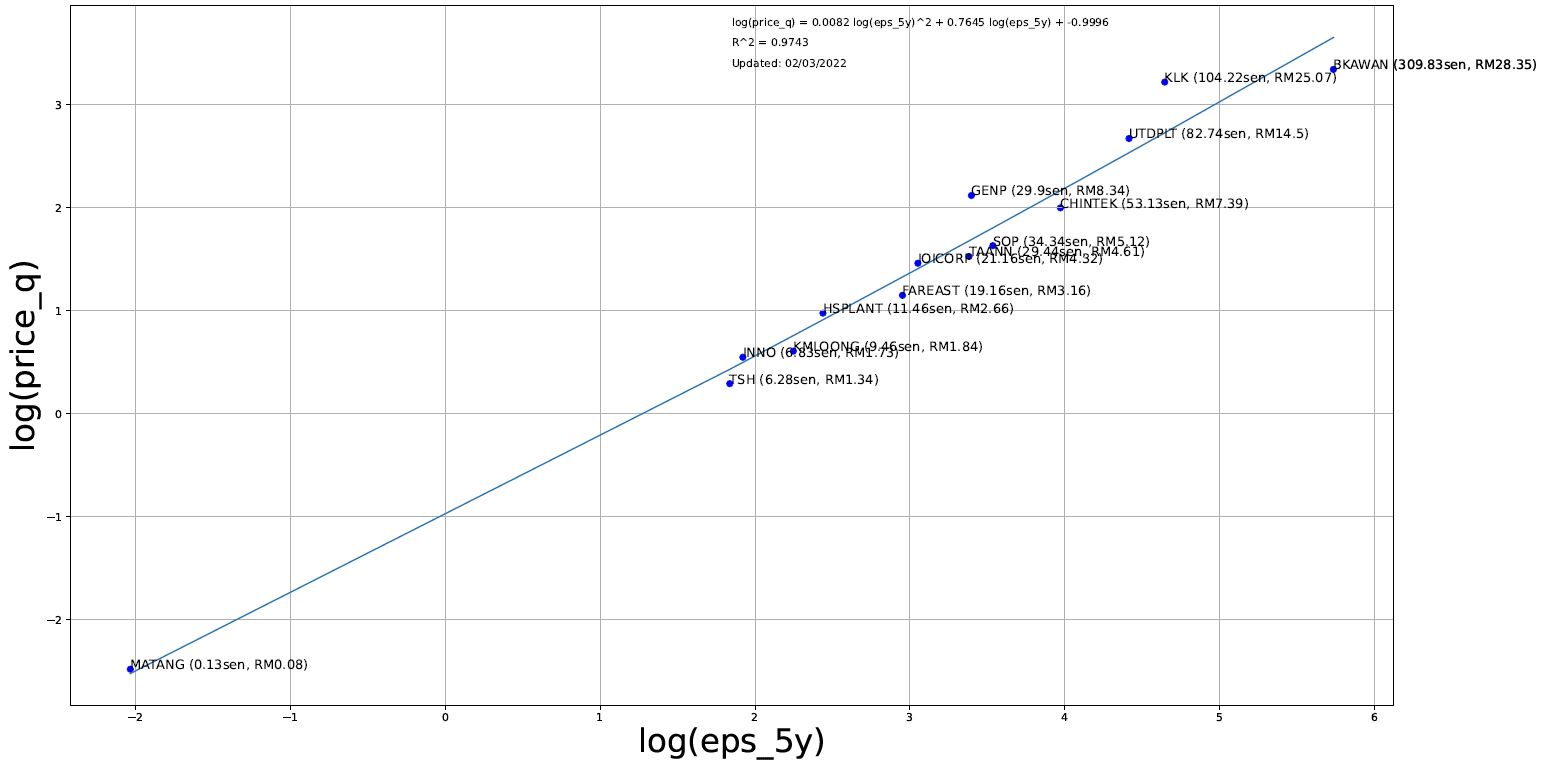
LVI: Plantation Sector Price to EPS Peer Comparison
Mark Goh
Publish date: Wed, 02 Mar 2022, 04:26 PM
Following my two posts (Energy and Semiconductor) Sector Price to EPS Peer Comparison) on sector Price to eps comparisons, 'plantation' stocks are lit right now too. So I took a stab -here it goes.
After using the same methodology, the plantation stocks that are left are:
INNO, KLK, TAANN, BKAWAN, SOP, UTDPLT, IOICORP, KMLOONG, FAREAST, HSPLANT, CHINTEK, TSH, GENP, MATANG
This time the plot looks extremely 'on the line' with an R squared of 0.97! There is no further proof needed that PE ratio works.

Caption: Right click and 'open in another tab' to see the full resolution graph.
If you want to know why some plantation stocks are more richly valued versus others? Answer: It is their earnings track record. The higher the eps_5y then the higher the price.
Hope my analysis helps you in hunting for value stocks. If you draw any conclusions on the plot above do write your comments below.
Thank you
More articles on Little Value Investor
Created by Mark Goh | Mar 11, 2022


