


Little Value Investor
LVI: Property Sector Price to EPS Peer Comparison

Mark Goh
Publish date: Thu, 03 Mar 2022, 12:12 PM
Mark Goh
0 10
Little Value Investor is my public (but also personal) archive of my investing ideas so that I can look back at my previous self to reflect.
I have been investing starting in 2016 when my bestfriend convinced me to invest. Mostly self thought, my early journey have been binge watching Professor's Damodaran NYU Stern University's semester classes on Valuation. Now, in my free time I read announcements, quarterly and annual reports.
I have been investing starting in 2016 when my bestfriend convinced me to invest. Mostly self thought, my early journey have been binge watching Professor's Damodaran NYU Stern University's semester classes on Valuation. Now, in my free time I read announcements, quarterly and annual reports.
In continuation of my series of sector analysis (previously Semiconductor, Energy, and Plantation) let's look at the property sector.
After using the same methodology, the property stocks that are left are:
ACME, ASIAPAC, AYER, BCB, CRESNDO, CVIEW, DPS,
ECOFIRS, ECOWLD, EUPE, EWEIN, EWINT, GLOMAC, GMUTUAL,
GUOCO, HCK, IBHD, IBRACO, IDEAL, IGBB, IOIPG,
IWCITY, JIANKUN, JKGLAND, KEN, KPPROP, KSL, L&G,
LAGENDA, LBICAP, LBS, MAHSING, MALTON, MATRIX, MCT,
MENANG, MJPERAK, MKH, MKLAND, MRCB, MUIPROP, NCT,
OIB, OSK, PARAMON, PLENITU, RAPID, SBCCORP, SDRED,
SEAL, SHL, SMI, SPSETIA, SUNSURIA, SYMLIFE, TAMBUN,
THRIVEN, TITIJYA, TROP, UEMS, UOADEV, Y&G, YNHPROP
However upon closer inspection of a randomly selected stock PARAMON, I noticed that the plot showed that it is relatively undervalues versus its peers (being that it is located below the regression line) and I noted that PARAMON have a one off large net profit in the quarter 31 March 2020 of RM474.6mil this might skew the results of 'average 5y of eps' calculation. Reason? I am not interested at this point - I am going to still maintain my scope of analysis to be sector wide and not on individual companies.
Solution: I apply an outlier filter for each stock to filter out any extraordinary gains in a particular quarter.
This would give me an indication of the relative valuation of the stock versus its peers 'without' considering any extraordinary gains in the last 5 years.
The results, for the property sector we get an R2 of 0.20 which indicates that there are many counters in the property market that are richly priced and many are also poorly priced. This I cannot say for the plantation sector of R2 of above >0.90 where it looks like the market has efficiently priced the plantation sector.
Property stocks under the regression line would be considered undervalued versus its peers that are on the line or above it. Conclusively, there are higher chance of hunting for value stocks in the property sector right now.
Hope this helps with your selection of any property stocks you might have. Interested to read any other conclusion that you may draw from my analysis - please put them in the comment below.
Thank you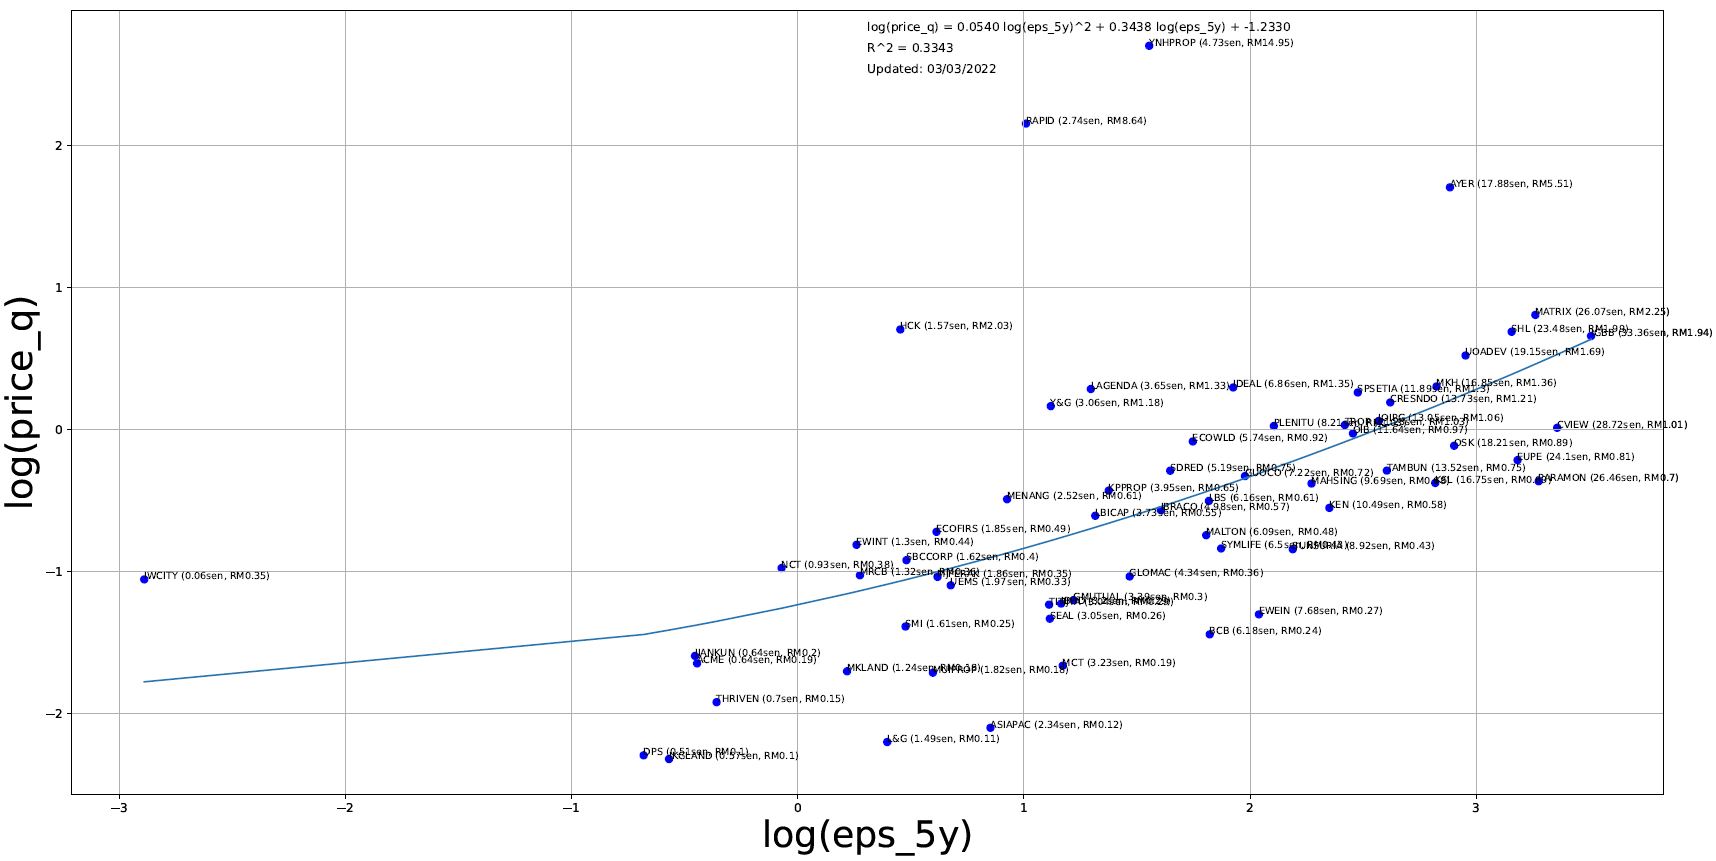 Caption: To view full size image please right click and view the image in another tab.
More articles on Little Value Investor
LVI: Food & Beverages Sector Price to EPS Peer Comparison (and economic moat)
Created by Mark Goh | Mar 11, 2022
Discussions
Be the first to like this. Showing 0 of 0 comments
Post a Comment
Featured Posts


Latest Videos


Apps


Top Articles
1
Dragon Leong blog
2
Stock Market Enthusiast
Feng Shui Market Outlook for FBM KLCI in the Year of the Wood Snake (2025)
3
THE INVESTMENT APPROACH OF CALVIN TAN
4
Bursa Stock Talk
5
Kenanga Research & Investment
Oil & Gas - Dissecting Petronas and Trump's Impact on the Sector (OVERWEIGHT)
6
TA Sector Research
7
Rakuten Trade Research Reports
8
My Trading Adventure 2025
#
Stock
Score
Daily Stocks
Stock Name
Last
Change
Volume
Stock Name
Last
Change
Volume
Stock Name
Last
Change
Volume
MQ Trading Signals
Stock
Time
Signal
Duration
Stock
Time
Signal
Duration
Featured Advertisers / Partners


Ride The Bull Short The Bear
CS Tan
4.9 / 5.0
This book is the result of the author's many years of experience and observation throughout his 26 years in the stockbroking industry. It was written for general public to learn to invest based on facts and not on fantasies or hearsay....